
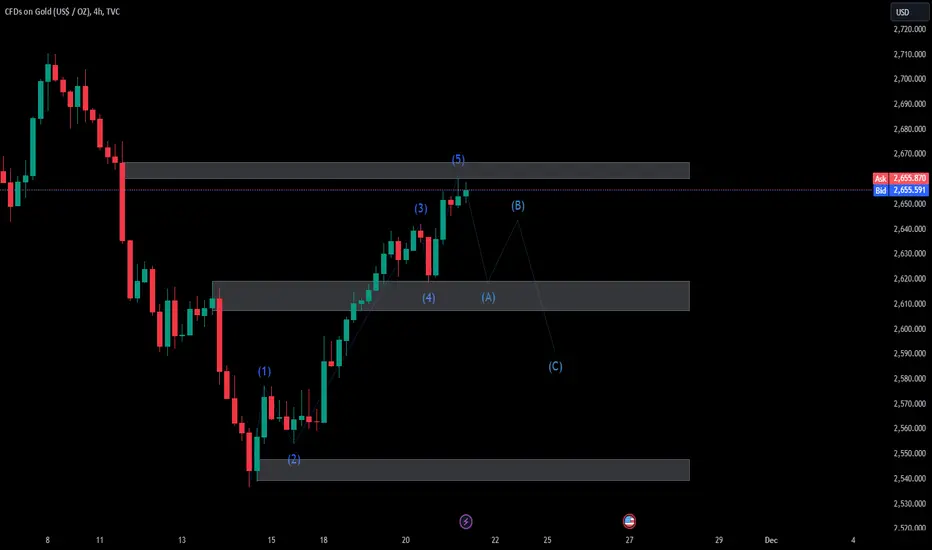
The 4-hour XAU/USD chart shows a completed Elliott Wave (1-5) structure, with wave (5) reaching the $2,655-$2,660 resistance zone, indicating a potential reversal. A corrective ABC pattern is expected:
As gold prices are highly sensitive to macroeconomic events, traders should use proper position sizing and stop-loss levels to mitigate risks. Keep an eye on upcoming economic releases and geopolitical tensions that might affect market volatility.
Good luck
- Wave A: Targeting $2,620-$2,630 (middle support zone).
- Wave B: Minor retracement below $2,655.
- Wave C: Extending to $2,600-$2,610 (lower support).
As gold prices are highly sensitive to macroeconomic events, traders should use proper position sizing and stop-loss levels to mitigate risks. Keep an eye on upcoming economic releases and geopolitical tensions that might affect market volatility.
Good luck
노트
Update new resistance: 액티브 트레이드
now price hit resistance so wait drop to make wave A :) but if It break up resistance so find your stop loss
good luck :)
거래청산: 스탑 닿음

관련 발행물
면책사항
해당 정보와 게시물은 금융, 투자, 트레이딩 또는 기타 유형의 조언이나 권장 사항으로 간주되지 않으며, 트레이딩뷰에서 제공하거나 보증하는 것이 아닙니다. 자세한 내용은 이용 약관을 참조하세요.
면책사항
해당 정보와 게시물은 금융, 투자, 트레이딩 또는 기타 유형의 조언이나 권장 사항으로 간주되지 않으며, 트레이딩뷰에서 제공하거나 보증하는 것이 아닙니다. 자세한 내용은 이용 약관을 참조하세요.