
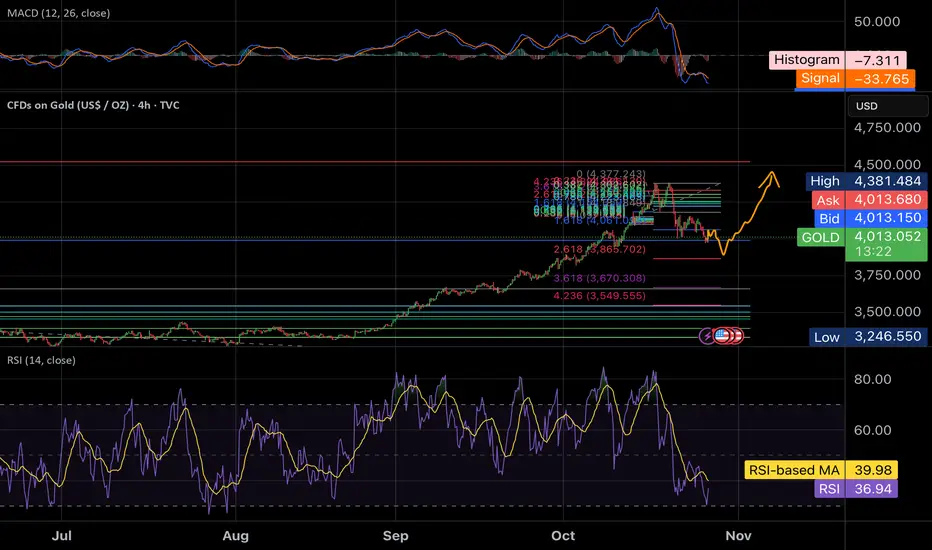
You’re looking at a 4-hour chart of Gold (XAUUSD) with a combination of Fibonacci extensions, RSI, and MACD indicators.
1. Price action & Fibonacci levels
• Current price: around $4,008.
• The chart shows retracement and extension levels, with key Fibonacci zones marked (0.618, 1.618, 2.618, etc.).
• The price recently retraced to the 1.618 level (~$4,010) — a common Fibonacci support zone — and bounced slightly.
• There’s also a 2.618 extension at $3,865, suggesting that if $4,000 fails as support, the next downside target could be around $3,865.
2. MACD (top indicator)
• MACD Line (blue) is well below the Signal Line (orange) → strong bearish momentum.
• Histogram is negative (–7.643), confirming the bearish trend.
• However, the histogram bars are starting to shrink, which can often signal bearish exhaustion or a potential bullish reversal coming.
3. RSI (bottom indicator)
• RSI = 35.93, with the RSI-based MA at 39.91.
• This means Gold is nearing oversold territory (below 30) — it’s not extreme yet, but buyers might soon step in.
• If RSI turns up and crosses the MA, it could confirm the beginning of a short-term reversal.
4. Projected path (orange line on chart)
• The drawn orange curve shows a possible bounce scenario:
• Gold could dip slightly below $4,000 or test $3,865 (2.618 level),
• then begin a gradual recovery toward $4,380–$4,400.
• That’s in line with a Fibonacci retracement to 1.0–1.618 area — a common recovery zone after a sharp drop.
5. Summary
Indicator Current Bias Signal
Price Action Slightly Bearish Approaching support zone
Fibonacci Key support at $4,000, next at $3,865 Possible bounce
MACD Bearish but flattening Early reversal potential
RSI Near oversold Could trigger rebound soon
Quick Take:
Gold might dip slightly lower (possibly to $3,865), but technicals suggest a bullish reversal may follow in early November, targeting the $4,380–$4,400 area.
1. Price action & Fibonacci levels
• Current price: around $4,008.
• The chart shows retracement and extension levels, with key Fibonacci zones marked (0.618, 1.618, 2.618, etc.).
• The price recently retraced to the 1.618 level (~$4,010) — a common Fibonacci support zone — and bounced slightly.
• There’s also a 2.618 extension at $3,865, suggesting that if $4,000 fails as support, the next downside target could be around $3,865.
2. MACD (top indicator)
• MACD Line (blue) is well below the Signal Line (orange) → strong bearish momentum.
• Histogram is negative (–7.643), confirming the bearish trend.
• However, the histogram bars are starting to shrink, which can often signal bearish exhaustion or a potential bullish reversal coming.
3. RSI (bottom indicator)
• RSI = 35.93, with the RSI-based MA at 39.91.
• This means Gold is nearing oversold territory (below 30) — it’s not extreme yet, but buyers might soon step in.
• If RSI turns up and crosses the MA, it could confirm the beginning of a short-term reversal.
4. Projected path (orange line on chart)
• The drawn orange curve shows a possible bounce scenario:
• Gold could dip slightly below $4,000 or test $3,865 (2.618 level),
• then begin a gradual recovery toward $4,380–$4,400.
• That’s in line with a Fibonacci retracement to 1.0–1.618 area — a common recovery zone after a sharp drop.
5. Summary
Indicator Current Bias Signal
Price Action Slightly Bearish Approaching support zone
Fibonacci Key support at $4,000, next at $3,865 Possible bounce
MACD Bearish but flattening Early reversal potential
RSI Near oversold Could trigger rebound soon
Quick Take:
Gold might dip slightly lower (possibly to $3,865), but technicals suggest a bullish reversal may follow in early November, targeting the $4,380–$4,400 area.

면책사항
해당 정보와 게시물은 금융, 투자, 트레이딩 또는 기타 유형의 조언이나 권장 사항으로 간주되지 않으며, 트레이딩뷰에서 제공하거나 보증하는 것이 아닙니다. 자세한 내용은 이용 약관을 참조하세요.
면책사항
해당 정보와 게시물은 금융, 투자, 트레이딩 또는 기타 유형의 조언이나 권장 사항으로 간주되지 않으며, 트레이딩뷰에서 제공하거나 보증하는 것이 아닙니다. 자세한 내용은 이용 약관을 참조하세요.