
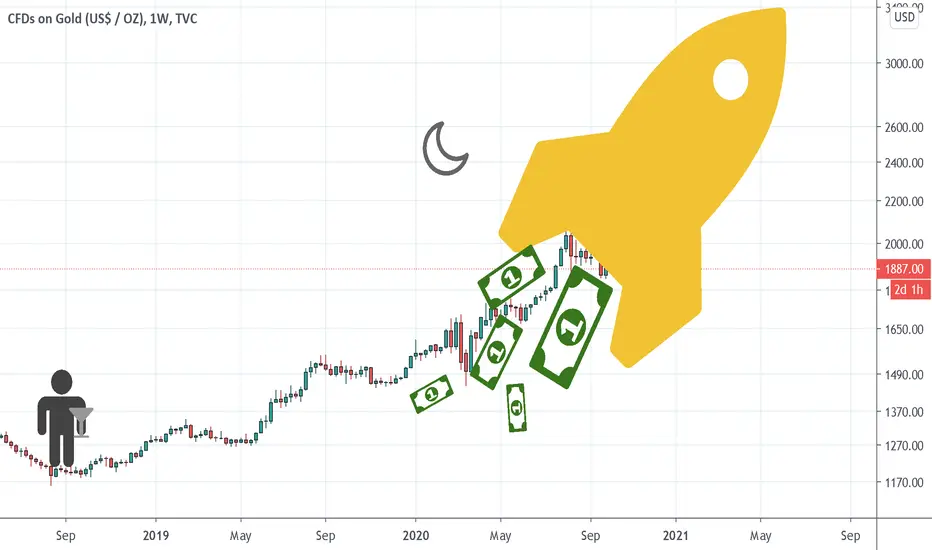
Gold is zooming.
Why?
The DXY.
As we can see on the monthly DXY chart, the developing pattern parallels history.
1. It bounced off the 200 EMA
2. It broke trend, retested, and failed
3. It collapsed
The RSI and MACD are weak

What happened to Gold last time DXY collapsed?

Trading Signals
Buy Signal: Weekly RSI lows

Sell Signal: Weekly RSI highs

See previous posts for fibonacci extension targets.
Long MGC futures Feb(G)2021
Trading is risky and should not be attempted, ever.
Why?
The DXY.
As we can see on the monthly DXY chart, the developing pattern parallels history.
1. It bounced off the 200 EMA
2. It broke trend, retested, and failed
3. It collapsed
The RSI and MACD are weak
What happened to Gold last time DXY collapsed?
Trading Signals
Buy Signal: Weekly RSI lows
Sell Signal: Weekly RSI highs
See previous posts for fibonacci extension targets.
Long MGC futures Feb(G)2021
Trading is risky and should not be attempted, ever.
노트
Gold approaching major trendline, filtering out those big algo driven deviations in price. Have been accumulating shares of PHYS and CEF however, waiting to add to f u t u res position once the MACD drifts decisively above the zero bound.As mentioned previously even though the dominate trend is more correlated with Bonds, the DXY is impacting Gold at this time. Watching for another DXY leg down followed by a sharp, temporary recovery.
거래청산: 스탑 닿음
Technicals broke down and got stopped out (on MGC futures) but will pick it back up once there is a supportive daily candle. 
관련 발행물
면책사항
해당 정보와 게시물은 금융, 투자, 트레이딩 또는 기타 유형의 조언이나 권장 사항으로 간주되지 않으며, 트레이딩뷰에서 제공하거나 보증하는 것이 아닙니다. 자세한 내용은 이용 약관을 참조하세요.
면책사항
해당 정보와 게시물은 금융, 투자, 트레이딩 또는 기타 유형의 조언이나 권장 사항으로 간주되지 않으며, 트레이딩뷰에서 제공하거나 보증하는 것이 아닙니다. 자세한 내용은 이용 약관을 참조하세요.