
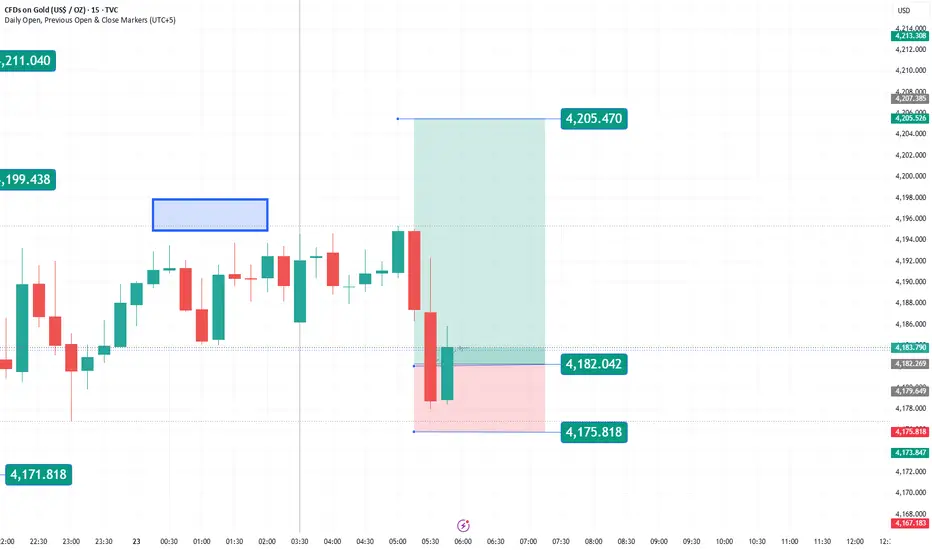
XAU/USD is showing signs of short-term weakness on the 15-minute chart after failing to sustain momentum near the 4,195 resistance area. The market experienced a sharp bearish selloff from the highlighted supply zone, pushing price down toward the 4,176 support region. This decline suggests that sellers remain active at higher levels, while buyers are attempting to defend key support.
The chart outlines a potential long setup with an entry around 4,182.04, a stop loss at 4,175.82, and an upside target near 4,205.47. The recent bullish reaction from support indicates that buyers are stepping in, creating the possibility of a recovery toward the upper resistance zone. However, confirmation is still needed, as the broader move remains corrective following the sharp bearish candle.
Traders should watch for strong bullish candles and increased volume above 4,182 to validate the setup. A successful hold above 4,176 could trigger a move toward 4,205, while a breakdown below support may expose lower levels. Overall, the outlook remains cautiously bullish above support.
The chart outlines a potential long setup with an entry around 4,182.04, a stop loss at 4,175.82, and an upside target near 4,205.47. The recent bullish reaction from support indicates that buyers are stepping in, creating the possibility of a recovery toward the upper resistance zone. However, confirmation is still needed, as the broader move remains corrective following the sharp bearish candle.
Traders should watch for strong bullish candles and increased volume above 4,182 to validate the setup. A successful hold above 4,176 could trigger a move toward 4,205, while a breakdown below support may expose lower levels. Overall, the outlook remains cautiously bullish above support.
거래청산: 스탑 닿음
sl hit
관련 발행물
면책사항
해당 정보와 게시물은 금융, 투자, 트레이딩 또는 기타 유형의 조언이나 권장 사항으로 간주되지 않으며, 트레이딩뷰에서 제공하거나 보증하는 것이 아닙니다. 자세한 내용은 이용 약관을 참조하세요.
관련 발행물
면책사항
해당 정보와 게시물은 금융, 투자, 트레이딩 또는 기타 유형의 조언이나 권장 사항으로 간주되지 않으며, 트레이딩뷰에서 제공하거나 보증하는 것이 아닙니다. 자세한 내용은 이용 약관을 참조하세요.