
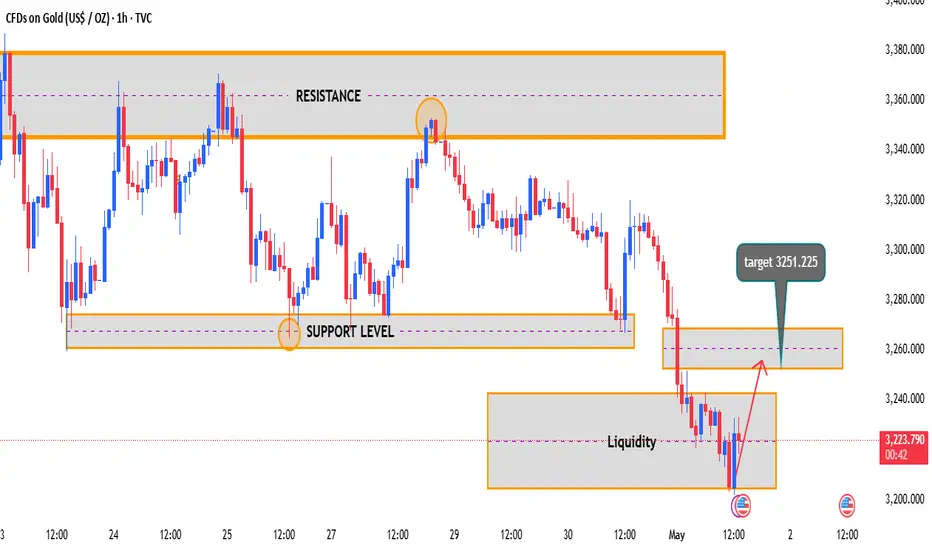
This chart showcases a liquidity grab followed by a potential bullish reaction in Gold (XAU/USD).
Key Technical Highlights:
- Resistance Zone: Clearly defined around the 3,370 level, where price has consistently faced rejection.
- Support Level: Identified near the 3,220–3,230 zone, which was recently swept to collect liquidity.
- Liquidity Zone: Price dipped below support to trigger stop-losses before rebounding, signaling a possible bullish reversal.
Projected Move:
The chart suggests a bounce toward the next target at 3251.225, aligning with a previously broken support now turned resistance.
If momentum sustains, further upside could be explored toward the mid-supply zone.
Summary: The recent liquidity sweep hints at a potential short-term bullish move, with a target retracement to 3251.225. Traders should monitor price reaction at that level for confirmation or rejection.
Key Technical Highlights:
- Resistance Zone: Clearly defined around the 3,370 level, where price has consistently faced rejection.
- Support Level: Identified near the 3,220–3,230 zone, which was recently swept to collect liquidity.
- Liquidity Zone: Price dipped below support to trigger stop-losses before rebounding, signaling a possible bullish reversal.
Projected Move:
The chart suggests a bounce toward the next target at 3251.225, aligning with a previously broken support now turned resistance.
If momentum sustains, further upside could be explored toward the mid-supply zone.
Summary: The recent liquidity sweep hints at a potential short-term bullish move, with a target retracement to 3251.225. Traders should monitor price reaction at that level for confirmation or rejection.

면책사항
해당 정보와 게시물은 금융, 투자, 트레이딩 또는 기타 유형의 조언이나 권장 사항으로 간주되지 않으며, 트레이딩뷰에서 제공하거나 보증하는 것이 아닙니다. 자세한 내용은 이용 약관을 참조하세요.
면책사항
해당 정보와 게시물은 금융, 투자, 트레이딩 또는 기타 유형의 조언이나 권장 사항으로 간주되지 않으며, 트레이딩뷰에서 제공하거나 보증하는 것이 아닙니다. 자세한 내용은 이용 약관을 참조하세요.