
Fundamental analysis:
A new round of tariff shocks has become a core factor affecting the trend of gold prices. "The rebound in gold reflects the market's growing concerns about tariff threats and the possible reshaping of global trade norms."
Technical interpretation:
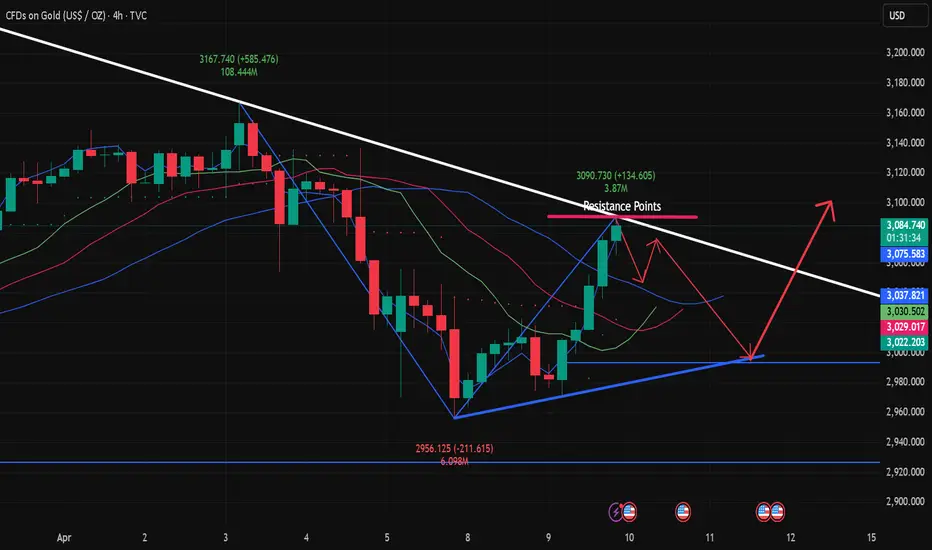
The 4-hour chart shows that gold prices have now formed a clear upward channel, with support and resistance lines connecting lows and highs respectively. Recently, the price came near the MA200 moving average, and at the same time found buying near the key support level of $3015.00. From the MACD indicator, the DIFF line (0.41) and the DEA line (-8.65) have formed a golden cross, and the bar chart has turned red and the volume has increased, suggesting that upward momentum is accumulating. The RSI indicator is at the 60.47 level, close to but not yet in the overbought area, indicating that there is still room for upward movement. The CCI indicator is at 150.94. Although it is in the overbought area, the trend is strong and no obvious top divergence has yet to appear. It is worth noting that the recent price has not fallen below the lower track of the rising channel during the decline, indicating that bulls are still dominant.
Operational analysis:
The gold price is currently at a key technical position and has just retested the support level near MA55. If it can stand firm at this position, it is expected to retest the resistance level of $3090.00, and further breakthroughs may challenge the previous high of $3167.60. The short-term MACD golden cross signal strengthens the bullish expectations, but if the support of $3015.00 cannot be maintained, it may fall back to $2980.00. The lower track of the rising channel will be the key line of defense for the long-short boundary.
A new round of tariff shocks has become a core factor affecting the trend of gold prices. "The rebound in gold reflects the market's growing concerns about tariff threats and the possible reshaping of global trade norms."
Technical interpretation:
The 4-hour chart shows that gold prices have now formed a clear upward channel, with support and resistance lines connecting lows and highs respectively. Recently, the price came near the MA200 moving average, and at the same time found buying near the key support level of $3015.00. From the MACD indicator, the DIFF line (0.41) and the DEA line (-8.65) have formed a golden cross, and the bar chart has turned red and the volume has increased, suggesting that upward momentum is accumulating. The RSI indicator is at the 60.47 level, close to but not yet in the overbought area, indicating that there is still room for upward movement. The CCI indicator is at 150.94. Although it is in the overbought area, the trend is strong and no obvious top divergence has yet to appear. It is worth noting that the recent price has not fallen below the lower track of the rising channel during the decline, indicating that bulls are still dominant.
Operational analysis:
The gold price is currently at a key technical position and has just retested the support level near MA55. If it can stand firm at this position, it is expected to retest the resistance level of $3090.00, and further breakthroughs may challenge the previous high of $3167.60. The short-term MACD golden cross signal strengthens the bullish expectations, but if the support of $3015.00 cannot be maintained, it may fall back to $2980.00. The lower track of the rising channel will be the key line of defense for the long-short boundary.
액티브 트레이드
Reference data for the day:US March unadjusted CPI annual rate
US March seasonally adjusted CPI monthly rate
US initial jobless claims for the week ending April 5 (10,000 people)
US March seasonally adjusted core CPI monthly rate
US March unadjusted core CPI annual rate
거래청산: 타겟 닿음
Trading is active and it is correcting as we predicted.노트
90 Enter the market at high point and short sell, profit 30 points
관련 발행물
면책사항
해당 정보와 게시물은 금융, 투자, 트레이딩 또는 기타 유형의 조언이나 권장 사항으로 간주되지 않으며, 트레이딩뷰에서 제공하거나 보증하는 것이 아닙니다. 자세한 내용은 이용 약관을 참조하세요.
관련 발행물
면책사항
해당 정보와 게시물은 금융, 투자, 트레이딩 또는 기타 유형의 조언이나 권장 사항으로 간주되지 않으며, 트레이딩뷰에서 제공하거나 보증하는 것이 아닙니다. 자세한 내용은 이용 약관을 참조하세요.