
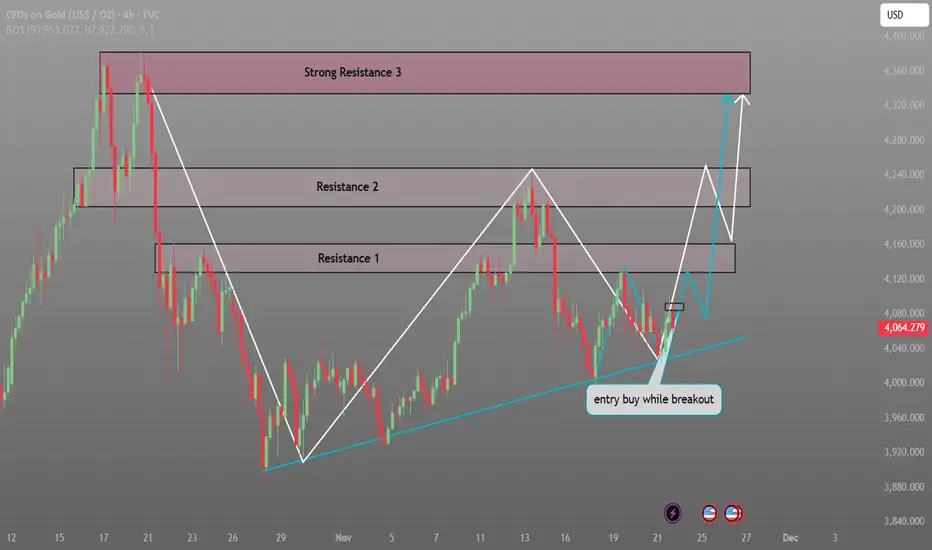
XAUUSD BREAKOUT ENTRY
📈 Chart Overview and Trend Analysis
Trendlines: An ascending trendline (the lower, light blue dashed line) is drawn, connecting several higher lows. This suggests the price has been forming a short-to-medium-term uptrend or is consolidating within an ascending triangle pattern.
Price Movement: The price action has been characterized by sharp declines (like the one starting in late October) followed by a series of higher lows, which are bouncing off the ascending trendline.
Current Price Area: The price is consolidating near the ascending trendline and appears to be forming a tighter range before a potential move. The price is currently at 4,064.279.
🛑 Identified Key Levels
The chart highlights several potential resistance levels, which are areas where selling pressure is expected to be strong and reverse or pause the price movement.
Resistance 1: The lowest rectangular zone (around 4,100 - 4,140).
Resistance 2: The middle rectangular zone (around 4,160 - 4,200).
Strong Resistance 3: The highest rectangular zone, marking the prior peak (around 4,240 and above).
These levels represent areas of prior price congestion or reversal points, making them significant hurdles for the price to overcome.
🎯 Potential Trade Setup
The image explicitly suggests a Buy Entry based on a breakout:
Entry Trigger: The text "entry buy while breakout" is placed near the current price action.
Breakout Area: The accompanying white arrows suggest a potential future path where the price breaks out of the current consolidation/range to the upside.
Target: The arrows indicate the target levels are Resistance 1, Resistance 2, and ultimately, Strong Resistance 3.
Interpretation: The trader is looking for a bullish continuation trade. They plan to enter a long position if the price closes strongly above the recent high of the current consolidation or a key short-term resistance (not explicitly labeled, but implied by the arrow's start), betting that this breakout will lead to a retest of the higher resistance zones.
Would you like me to identify any other specific technical patterns or help analyze the potential risk/reward of this setup?
📈 Chart Overview and Trend Analysis
Trendlines: An ascending trendline (the lower, light blue dashed line) is drawn, connecting several higher lows. This suggests the price has been forming a short-to-medium-term uptrend or is consolidating within an ascending triangle pattern.
Price Movement: The price action has been characterized by sharp declines (like the one starting in late October) followed by a series of higher lows, which are bouncing off the ascending trendline.
Current Price Area: The price is consolidating near the ascending trendline and appears to be forming a tighter range before a potential move. The price is currently at 4,064.279.
🛑 Identified Key Levels
The chart highlights several potential resistance levels, which are areas where selling pressure is expected to be strong and reverse or pause the price movement.
Resistance 1: The lowest rectangular zone (around 4,100 - 4,140).
Resistance 2: The middle rectangular zone (around 4,160 - 4,200).
Strong Resistance 3: The highest rectangular zone, marking the prior peak (around 4,240 and above).
These levels represent areas of prior price congestion or reversal points, making them significant hurdles for the price to overcome.
🎯 Potential Trade Setup
The image explicitly suggests a Buy Entry based on a breakout:
Entry Trigger: The text "entry buy while breakout" is placed near the current price action.
Breakout Area: The accompanying white arrows suggest a potential future path where the price breaks out of the current consolidation/range to the upside.
Target: The arrows indicate the target levels are Resistance 1, Resistance 2, and ultimately, Strong Resistance 3.
Interpretation: The trader is looking for a bullish continuation trade. They plan to enter a long position if the price closes strongly above the recent high of the current consolidation or a key short-term resistance (not explicitly labeled, but implied by the arrow's start), betting that this breakout will lead to a retest of the higher resistance zones.
Would you like me to identify any other specific technical patterns or help analyze the potential risk/reward of this setup?
액티브 트레이드
Our first target hit and running in profit. 
Free Forex signals & Daily updates 💹
t.me/+D1falYavqJAxMzE0
For any assistance contact us 🤓
t.me/Travis_816
Join Us Today On Telegram 👆👆
t.me/+D1falYavqJAxMzE0
For any assistance contact us 🤓
t.me/Travis_816
Join Us Today On Telegram 👆👆
면책사항
해당 정보와 게시물은 금융, 투자, 트레이딩 또는 기타 유형의 조언이나 권장 사항으로 간주되지 않으며, 트레이딩뷰에서 제공하거나 보증하는 것이 아닙니다. 자세한 내용은 이용 약관을 참조하세요.
Free Forex signals & Daily updates 💹
t.me/+D1falYavqJAxMzE0
For any assistance contact us 🤓
t.me/Travis_816
Join Us Today On Telegram 👆👆
t.me/+D1falYavqJAxMzE0
For any assistance contact us 🤓
t.me/Travis_816
Join Us Today On Telegram 👆👆
면책사항
해당 정보와 게시물은 금융, 투자, 트레이딩 또는 기타 유형의 조언이나 권장 사항으로 간주되지 않으며, 트레이딩뷰에서 제공하거나 보증하는 것이 아닙니다. 자세한 내용은 이용 약관을 참조하세요.