
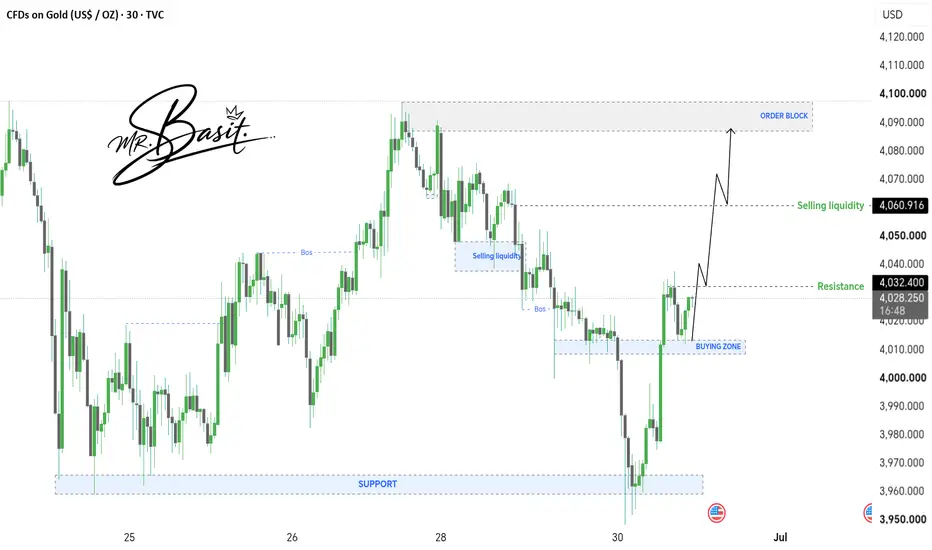
The market initially maintained a bearish displacement phase, forming lower highs and lower lows until price approached a major support liquidity pool around 3,960. This region acted as a significant institutional interest level where liquidity was accumulated.
A sell-side liquidity sweep occurred below support, indicating that stops were taken before a strong bullish displacement followed. This behavior suggests a potential reversal or re-accumulation phase rather than continued bearish momentum.
Structural Confirmation
Break of Structure (BOS):
Multiple internal BOS formations confirm shifting momentum during both bearish and recovery phases.
Liquidity Sweep:
Below 3,960 support, price engineered a sweep of sell-side liquidity before reversing sharply upward.
Displacement:
Strong bullish candle expansion confirms institutional participation and efficiency move away from discounted prices.
Key Technical Zones
Major Support / Demand Base: 3,960
Current Resistance Level: 4,032.400
Sell-Side Liquidity Pool: 4,060.916
Order Block (Bearish Origin Zone): 4,080 – 4,100
Active Buying Zone: Post-sweep accumulation region near recent lows
Market Interpretation
The current structure suggests a transition from accumulation → markup phase. Price has already completed a liquidity raid and is now attempting to build bullish continuation momentum.
The immediate focus remains on whether price can sustain above the internal resistance (4,032), which would confirm continuation toward higher liquidity levels.
Failure to hold above the buying zone would invalidate bullish continuation and potentially return price back into deeper support mitigation.
Bias
Short-term bias: Bullish continuation while above 3,960
Primary target zones:
First liquidity: 4,060.916
Extended target: 4,080 – 4,100 (Order Block region)
Invalidation: Sustained break below 3,960 support
Conclusion
The chart represents a classic liquidity-driven reversal model, where a sell-side sweep has been followed by strong bullish displacement. Price is currently in a retracement phase within a newly forming bullish structure, with upside continuation dependent on confirmation above key resistance levels.
A sell-side liquidity sweep occurred below support, indicating that stops were taken before a strong bullish displacement followed. This behavior suggests a potential reversal or re-accumulation phase rather than continued bearish momentum.
Structural Confirmation
Break of Structure (BOS):
Multiple internal BOS formations confirm shifting momentum during both bearish and recovery phases.
Liquidity Sweep:
Below 3,960 support, price engineered a sweep of sell-side liquidity before reversing sharply upward.
Displacement:
Strong bullish candle expansion confirms institutional participation and efficiency move away from discounted prices.
Key Technical Zones
Major Support / Demand Base: 3,960
Current Resistance Level: 4,032.400
Sell-Side Liquidity Pool: 4,060.916
Order Block (Bearish Origin Zone): 4,080 – 4,100
Active Buying Zone: Post-sweep accumulation region near recent lows
Market Interpretation
The current structure suggests a transition from accumulation → markup phase. Price has already completed a liquidity raid and is now attempting to build bullish continuation momentum.
The immediate focus remains on whether price can sustain above the internal resistance (4,032), which would confirm continuation toward higher liquidity levels.
Failure to hold above the buying zone would invalidate bullish continuation and potentially return price back into deeper support mitigation.
Bias
Short-term bias: Bullish continuation while above 3,960
Primary target zones:
First liquidity: 4,060.916
Extended target: 4,080 – 4,100 (Order Block region)
Invalidation: Sustained break below 3,960 support
Conclusion
The chart represents a classic liquidity-driven reversal model, where a sell-side sweep has been followed by strong bullish displacement. Price is currently in a retracement phase within a newly forming bullish structure, with upside continuation dependent on confirmation above key resistance levels.
액티브 트레이드
Trade active 노트
collected buy stops below support before reversing sharply upward.This movement confirms that liquidity below the market has been engineered and absorbed by institutional flow, resulting in a strong bullish displacement.
After the liquidity grab, the market showed immediate rejection and upward momentum, indicating that selling pressure was exhausted and buyers regained control.
Currently, price is transitioning from a liquidity sweep phase into a potential bullish continuation structure, with focus shifting toward higher liquidity levels above resistance.
Key Point:
The sell-side liquidity has been taken, and the market has responded with a reversal move, suggesting a shift in short-term market direction toward bullish continuation unless the structure breaks back below support.

What You'll Get
Daily Forex signals with high accuracy
t.me/+EdfnjydA0JIwZjM8
Technical & fundamental analysis
Risk management tips to protect your capital
Join now and start profit daily free signal
t.me/+dr1Qsh002WllMTI0
Daily Forex signals with high accuracy
t.me/+EdfnjydA0JIwZjM8
Technical & fundamental analysis
Risk management tips to protect your capital
Join now and start profit daily free signal
t.me/+dr1Qsh002WllMTI0
관련 발행물
면책사항
해당 정보와 게시물은 금융, 투자, 트레이딩 또는 기타 유형의 조언이나 권장 사항으로 간주되지 않으며, 트레이딩뷰에서 제공하거나 보증하는 것이 아닙니다. 자세한 내용은 이용 약관을 참조하세요.
What You'll Get
Daily Forex signals with high accuracy
t.me/+EdfnjydA0JIwZjM8
Technical & fundamental analysis
Risk management tips to protect your capital
Join now and start profit daily free signal
t.me/+dr1Qsh002WllMTI0
Daily Forex signals with high accuracy
t.me/+EdfnjydA0JIwZjM8
Technical & fundamental analysis
Risk management tips to protect your capital
Join now and start profit daily free signal
t.me/+dr1Qsh002WllMTI0
관련 발행물
면책사항
해당 정보와 게시물은 금융, 투자, 트레이딩 또는 기타 유형의 조언이나 권장 사항으로 간주되지 않으며, 트레이딩뷰에서 제공하거나 보증하는 것이 아닙니다. 자세한 내용은 이용 약관을 참조하세요.