
1️⃣ Market Structure & Liquidity Analysis
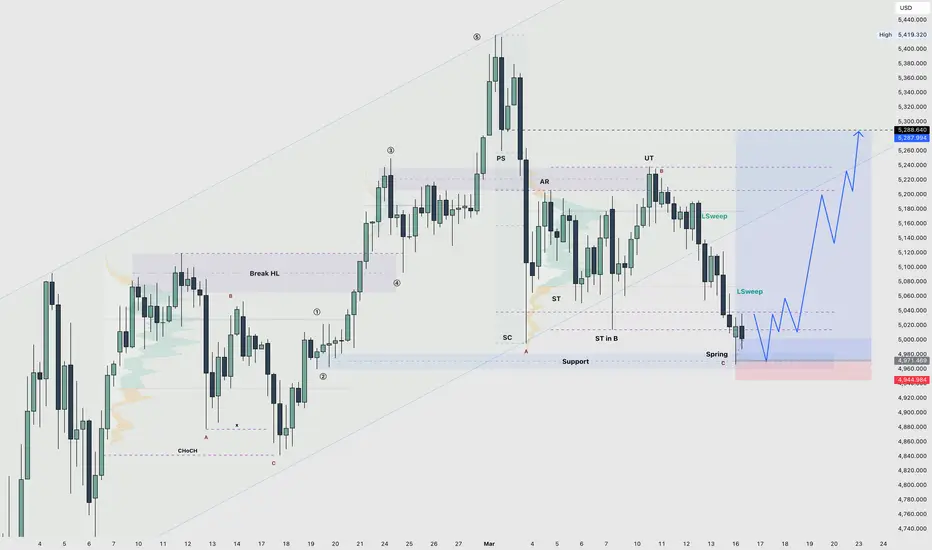
Gold remains inside a broader ascending channel while developing a Wyckoff accumulation range.
Structure shows: PS → AR → ST → UT (Phase B) → SC → developing Spring near 4,980–5,000.
The recent decline swept sell-side liquidity beneath the range lows and tapped into support. Downside momentum weakened immediately after the sweep, suggesting absorption rather than distribution.
Both sides of liquidity have now been engineered:
• UT cleared buy-side liquidity
• Spring cleared sell-side liquidity
Higher-timeframe structure remains intact.
2️⃣ Structural Outlook & Bias
If the Spring zone (4,960–5,000) holds:
• Phase D confirmation becomes likely
• 5,200 acts as reclaim trigger
• Expansion towards 5,300–5,380 becomes the natural liquidity objective
If the Spring fails:
• Deeper range rotation may occur before continuation
Current bias: Bullish continuation, conditional on Spring defence.
Compression suggests preparation for expansion, not breakdown.
Gold remains inside a broader ascending channel while developing a Wyckoff accumulation range.
Structure shows: PS → AR → ST → UT (Phase B) → SC → developing Spring near 4,980–5,000.
The recent decline swept sell-side liquidity beneath the range lows and tapped into support. Downside momentum weakened immediately after the sweep, suggesting absorption rather than distribution.
Both sides of liquidity have now been engineered:
• UT cleared buy-side liquidity
• Spring cleared sell-side liquidity
Higher-timeframe structure remains intact.
2️⃣ Structural Outlook & Bias
If the Spring zone (4,960–5,000) holds:
• Phase D confirmation becomes likely
• 5,200 acts as reclaim trigger
• Expansion towards 5,300–5,380 becomes the natural liquidity objective
If the Spring fails:
• Deeper range rotation may occur before continuation
Current bias: Bullish continuation, conditional on Spring defence.
Compression suggests preparation for expansion, not breakdown.

𝗠𝗮𝗿𝗸𝗲𝘁 𝗯𝗲𝗵𝗮𝘃𝗶𝗼𝘂𝗿 | 𝗗𝗲𝗰𝗶𝘀𝗶𝗼𝗻-𝗺𝗮𝗸𝗶𝗻𝗴
Trader | Investor | Analysis
𝗥𝗲𝗮𝗹-𝘁𝗶𝗺𝗲 𝗰𝗼𝗻𝘁𝗲𝘅𝘁 → Telegram
Telegram: t.me/sphyntrading
Trader | Investor | Analysis
𝗥𝗲𝗮𝗹-𝘁𝗶𝗺𝗲 𝗰𝗼𝗻𝘁𝗲𝘅𝘁 → Telegram
Telegram: t.me/sphyntrading
면책사항
해당 정보와 게시물은 금융, 투자, 트레이딩 또는 기타 유형의 조언이나 권장 사항으로 간주되지 않으며, 트레이딩뷰에서 제공하거나 보증하는 것이 아닙니다. 자세한 내용은 이용 약관을 참조하세요.
𝗠𝗮𝗿𝗸𝗲𝘁 𝗯𝗲𝗵𝗮𝘃𝗶𝗼𝘂𝗿 | 𝗗𝗲𝗰𝗶𝘀𝗶𝗼𝗻-𝗺𝗮𝗸𝗶𝗻𝗴
Trader | Investor | Analysis
𝗥𝗲𝗮𝗹-𝘁𝗶𝗺𝗲 𝗰𝗼𝗻𝘁𝗲𝘅𝘁 → Telegram
Telegram: t.me/sphyntrading
Trader | Investor | Analysis
𝗥𝗲𝗮𝗹-𝘁𝗶𝗺𝗲 𝗰𝗼𝗻𝘁𝗲𝘅𝘁 → Telegram
Telegram: t.me/sphyntrading
면책사항
해당 정보와 게시물은 금융, 투자, 트레이딩 또는 기타 유형의 조언이나 권장 사항으로 간주되지 않으며, 트레이딩뷰에서 제공하거나 보증하는 것이 아닙니다. 자세한 내용은 이용 약관을 참조하세요.