
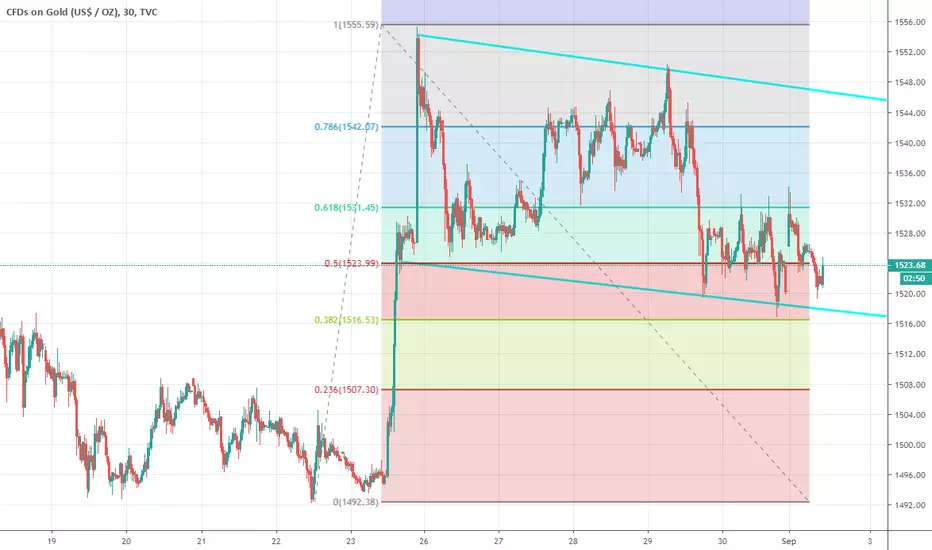
I know this one goes against my previous gold chart, but I think that this one can't be ignored. This looks like a huge/long bull flag on 30 min, price has closed below fib 50 level, which can mean thats it's not valid, but on my MT4 chart this close has been really smal and short, even if that's not a bull flag then it's a nice chanel. keep in mind this one, and remember USD will come down sooner or later. Lets see how this one plays out.
Good luck and enjoy trading!
My telegram small group. t.me/joinchat/KPtBs06gzWxrYDrhCoWGYA
Good luck and enjoy trading!
My telegram small group. t.me/joinchat/KPtBs06gzWxrYDrhCoWGYA
액티브 트레이드
Top line touched, Let see if we go back down or we break it and fly.
면책사항
해당 정보와 게시물은 금융, 투자, 트레이딩 또는 기타 유형의 조언이나 권장 사항으로 간주되지 않으며, 트레이딩뷰에서 제공하거나 보증하는 것이 아닙니다. 자세한 내용은 이용 약관을 참조하세요.
면책사항
해당 정보와 게시물은 금융, 투자, 트레이딩 또는 기타 유형의 조언이나 권장 사항으로 간주되지 않으며, 트레이딩뷰에서 제공하거나 보증하는 것이 아닙니다. 자세한 내용은 이용 약관을 참조하세요.