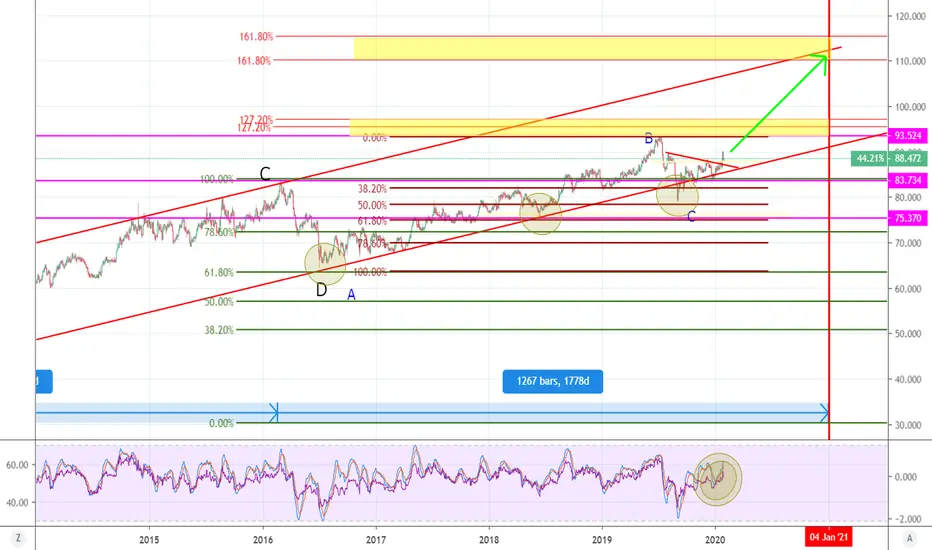
I recently posted a chart of silver showing the bearish case, I also shared a bullish case for the dollar. In order to confirm the theory of those two I share the gold silver ratio. It is obviously in a bull trend. it has been stair stepping up major fib resistance from the low in 2011 and a smaller sequence from 2016. firmly above the 61.8 on both and well positioned in the upward trend lines
-24th jan an obvious break out of the downward sloping wedge with conviction after testing the lower trend line and 50% fib from 2016 low.could even argue it is Head and shoulderish for this break
-MacD and RSI still have room to move before being oversold/overextended.
I see no reason why we cannot push to 100 or even to 110 before year end. this could be a combination of weak silver vs gold with gold not changing or gold moving up and silver not doing much.
time will tell.
-24th jan an obvious break out of the downward sloping wedge with conviction after testing the lower trend line and 50% fib from 2016 low.could even argue it is Head and shoulderish for this break
-MacD and RSI still have room to move before being oversold/overextended.
I see no reason why we cannot push to 100 or even to 110 before year end. this could be a combination of weak silver vs gold with gold not changing or gold moving up and silver not doing much.
time will tell.

면책사항
해당 정보와 게시물은 금융, 투자, 트레이딩 또는 기타 유형의 조언이나 권장 사항으로 간주되지 않으며, 트레이딩뷰에서 제공하거나 보증하는 것이 아닙니다. 자세한 내용은 이용 약관을 참조하세요.
면책사항
해당 정보와 게시물은 금융, 투자, 트레이딩 또는 기타 유형의 조언이나 권장 사항으로 간주되지 않으며, 트레이딩뷰에서 제공하거나 보증하는 것이 아닙니다. 자세한 내용은 이용 약관을 참조하세요.