
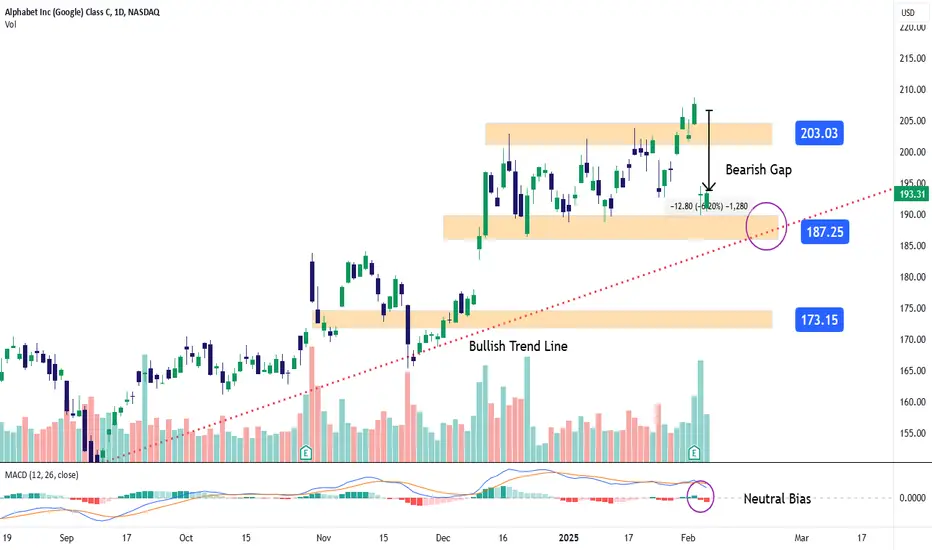
In recent sessions, Google's stock has recorded a decline of over 8% in just a couple of trading days, as market confidence weakens following the company's latest earnings report (February 4). Google Cloud services revenue grew by 30%, falling short of the expected 35%, signaling that competition in the cloud sector is becoming increasingly aggressive for Alphabet. This has dampened growth prospects for the company, leading to sustained selling pressure on the stock.
Uptrend at Risk
Google has maintained a solid uptrend since September 2024, with bullish momentum pushing the stock above the $200 per share level. However, the recent short-term bearish bias has cast doubts on the stock’s strength, as the price now approaches the trendline support level, where sellers must prove whether this movement is just a correction or a sign of a stronger bearish shift in the short term.
MACD Indicator
Currently, both the signal line and the MACD line have adopted a downward slope, while the histogram remains oscillating near the neutral 0 level. This indicates that the previous bullish dominance has faded, and if the histogram continues moving further away from the neutral zone, it could reinforce a stronger selling bias in the coming sessions.
Key Levels:
By Julian Pineda, CFA - Market Analyst
Uptrend at Risk
Google has maintained a solid uptrend since September 2024, with bullish momentum pushing the stock above the $200 per share level. However, the recent short-term bearish bias has cast doubts on the stock’s strength, as the price now approaches the trendline support level, where sellers must prove whether this movement is just a correction or a sign of a stronger bearish shift in the short term.
MACD Indicator
Currently, both the signal line and the MACD line have adopted a downward slope, while the histogram remains oscillating near the neutral 0 level. This indicates that the previous bullish dominance has faded, and if the histogram continues moving further away from the neutral zone, it could reinforce a stronger selling bias in the coming sessions.
Key Levels:
- $200: The most important resistance level, aligning with previous highs in Google’s stock. A rebound to this level could revive the long-term uptrend.
- $187: A critical new support zone, aligning with previous lows and the uptrend line support. Sustained movements below this level could reinforce the current bearish bias and threaten the long-term uptrend.
- $173: A major support level, corresponding to previous neutral price zones. A breakdown to this level could signal the beginning of a much more extended downtrend.
By Julian Pineda, CFA - Market Analyst

면책사항
해당 정보와 게시물은 금융, 투자, 트레이딩 또는 기타 유형의 조언이나 권장 사항으로 간주되지 않으며, 트레이딩뷰에서 제공하거나 보증하는 것이 아닙니다. 자세한 내용은 이용 약관을 참조하세요.
면책사항
해당 정보와 게시물은 금융, 투자, 트레이딩 또는 기타 유형의 조언이나 권장 사항으로 간주되지 않으며, 트레이딩뷰에서 제공하거나 보증하는 것이 아닙니다. 자세한 내용은 이용 약관을 참조하세요.