
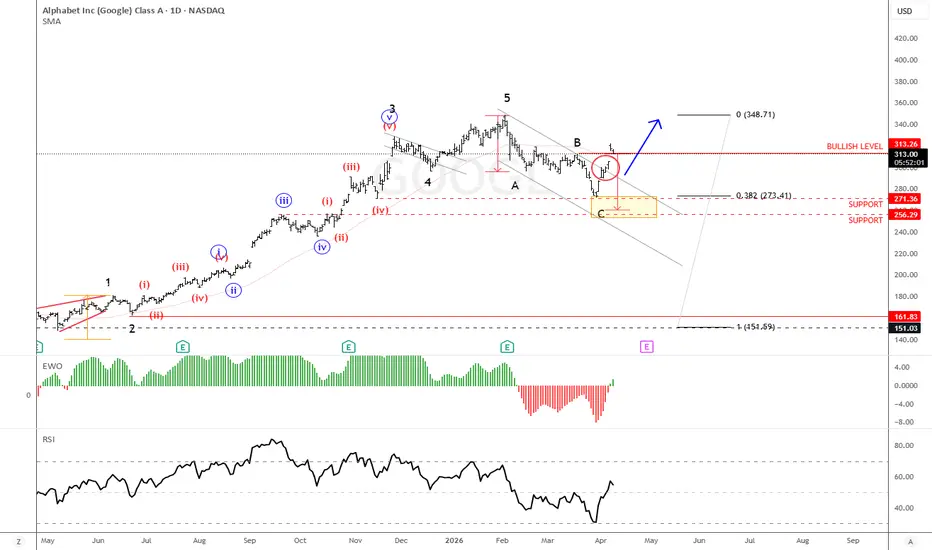
Over the past months, we discussed GOOGL’s recent five-wave impulse, which set the stage for the recent corrective structure. As expected, the stock has seen a strong rebound over the last two weeks after completing a three-wave decline into the 270 area that we had been tracking.
After a three-wave move, trends often resume, and in this case, it now looks very likely. Price has broken out of the downward channel and moved above the 317 bullish level, indicating that bulls are back in control. This increases the probability that the stock could push toward previous highs around 345.
As long as price holds above the 270 support, further upside is likely, making short-term buying on dips a favorable strategy.
Highlights:
Support at 270 is key to maintaining the bullish structure
Breakout of the channel and move above 317 confirms bullish momentum
Upside potential toward previous highs at 345
Buying dips favored while price stays above support
For those who bought in the yellow box, tighter stops are recommended
After a three-wave move, trends often resume, and in this case, it now looks very likely. Price has broken out of the downward channel and moved above the 317 bullish level, indicating that bulls are back in control. This increases the probability that the stock could push toward previous highs around 345.
As long as price holds above the 270 support, further upside is likely, making short-term buying on dips a favorable strategy.
Highlights:
Support at 270 is key to maintaining the bullish structure
Breakout of the channel and move above 317 confirms bullish momentum
Upside potential toward previous highs at 345
Buying dips favored while price stays above support
For those who bought in the yellow box, tighter stops are recommended
매매 수동청산
How traders, welcome to our new update. Not long ago, just around 3 weeks back, we highlighted a bullish outlook on Google based on a simple Elliott Wave view. We saw three waves down from the February highs, followed by a breakout above the downward channel after the stock reacted from our yellow box support zone.Google Follow Up: Bullish Trend Continues, But Pullback Risk Rising
Since then, we have seen a very nice and strong push to the upside, with price now already trading at new highs. At these levels, some may prefer to take profits rather than chase, or at least trail stops higher, as we never know how far the move can extend.
Looking at the updated chart, there is still room for a retest of the upper line of the impulsive channel, which could come in around 380 if we stick with the Elliott Wave structure. However, in the near term, there could be a pullback toward 330 as first support, especially ahead of earnings.
GH

Join the community for one week, full access. Its free >> @ wavetraders.com/elliott-wave-plans/
Learn Elliott Waves Sale-65%
👉 wavetraders.com/academy/
Newsletter
👉 bit.ly/3FVPVzO
Learn Elliott Waves Sale-65%
👉 wavetraders.com/academy/
Newsletter
👉 bit.ly/3FVPVzO
관련 발행물
면책사항
해당 정보와 게시물은 금융, 투자, 트레이딩 또는 기타 유형의 조언이나 권장 사항으로 간주되지 않으며, 트레이딩뷰에서 제공하거나 보증하는 것이 아닙니다. 자세한 내용은 이용 약관을 참조하세요.
Join the community for one week, full access. Its free >> @ wavetraders.com/elliott-wave-plans/
Learn Elliott Waves Sale-65%
👉 wavetraders.com/academy/
Newsletter
👉 bit.ly/3FVPVzO
Learn Elliott Waves Sale-65%
👉 wavetraders.com/academy/
Newsletter
👉 bit.ly/3FVPVzO
관련 발행물
면책사항
해당 정보와 게시물은 금융, 투자, 트레이딩 또는 기타 유형의 조언이나 권장 사항으로 간주되지 않으며, 트레이딩뷰에서 제공하거나 보증하는 것이 아닙니다. 자세한 내용은 이용 약관을 참조하세요.