
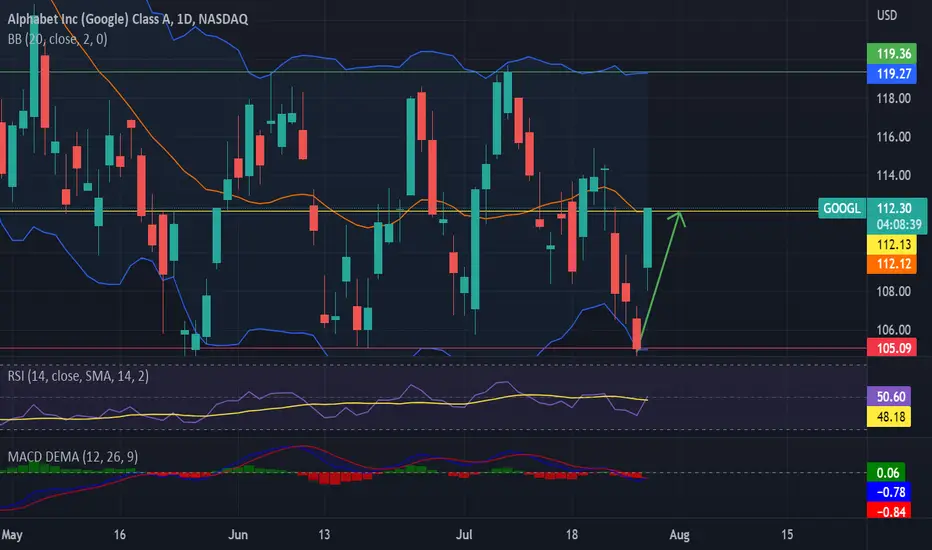
The 20-day ranged Bollinger band presents a support or lower bound (red line) equal to $105. This is the price in which the stock closed at yesterday the 26/07/22. Before today the, the stock’s price was equal to the Bollinger’s 20-day ranged support level indicating a bullish correction before further bearish movements in line with the current macroeconomic environment. Since trading has opened today, we have witnessed a correction towards the Bollinger’s resistance landing just beneath the Bollinger’s middle bound (orange line).
Bullish movements are further supported by RSI and SMA indicators. The purple RSI is beginning to cross the yellow SMA suggesting bullish stock price movements. Furthermore, the MACD indicator presents the red MACD line also crossing its blue signal further supporting a bullish swing before further bearish movement.
In line with these signals, I anticipate the stock to beat the Bollinger’s middle bound and anticipate a strengthening buying trend. For this swing trade, I have set a strike price equal to $112. My target is bullish, I will sell before the end of the week at price greater than this strike.
Bullish movements are further supported by RSI and SMA indicators. The purple RSI is beginning to cross the yellow SMA suggesting bullish stock price movements. Furthermore, the MACD indicator presents the red MACD line also crossing its blue signal further supporting a bullish swing before further bearish movement.
In line with these signals, I anticipate the stock to beat the Bollinger’s middle bound and anticipate a strengthening buying trend. For this swing trade, I have set a strike price equal to $112. My target is bullish, I will sell before the end of the week at price greater than this strike.

💥 Free signals and ideas ➡ t.me/vfinvestment
관련 발행물
면책사항
해당 정보와 게시물은 금융, 투자, 트레이딩 또는 기타 유형의 조언이나 권장 사항으로 간주되지 않으며, 트레이딩뷰에서 제공하거나 보증하는 것이 아닙니다. 자세한 내용은 이용 약관을 참조하세요.
💥 Free signals and ideas ➡ t.me/vfinvestment
관련 발행물
면책사항
해당 정보와 게시물은 금융, 투자, 트레이딩 또는 기타 유형의 조언이나 권장 사항으로 간주되지 않으며, 트레이딩뷰에서 제공하거나 보증하는 것이 아닙니다. 자세한 내용은 이용 약관을 참조하세요.