
**1. Key Observation**
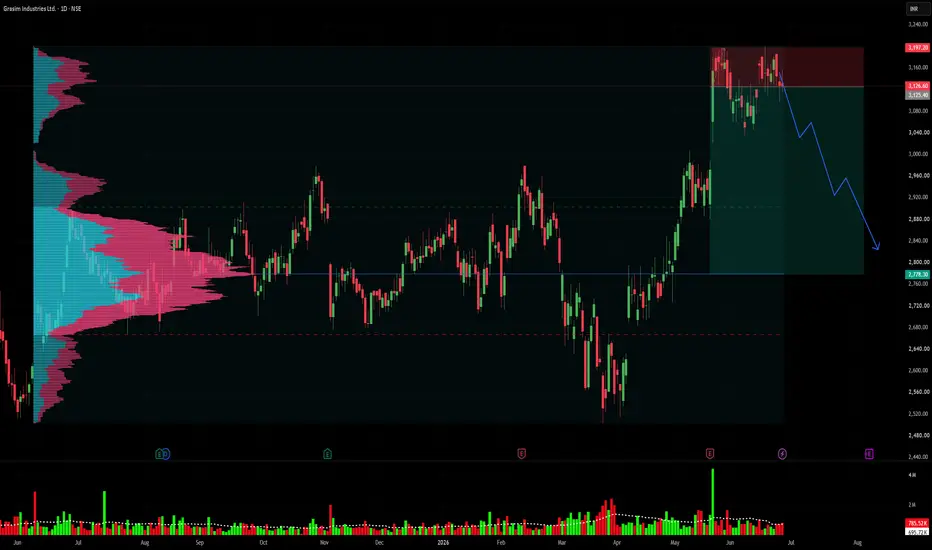
GRASIM looks weak near the upper resistance zone. Price is struggling around **₹3,126–₹3,197**, and the structure suggests that a short-term downtrend may be starting.
**2. My View**
My view is bearish as long as GRASIM stays below **₹3,197**. The stock may enter a correction phase and move lower in the coming weeks.
**3. Invalidation**
This bearish study becomes invalid if GRASIM breaks **₹3,197** and gives a daily close above it.
**4. Risk-Reward**
Risk is limited above **₹3,197**, while downside potential is towards **₹2,778**, so the setup looks favorable for a short-side study.
**5. Target Point / Range**
Target zone: **₹2,778**
**6. Why It’s Good for Short**
This setup is good for short because price is near resistance, upside is limited unless ₹3,197 breaks, and the chart shows early signs of downside continuation.
**7. Time Period**
This is a **3-month correction view** on the daily chart.
I am not a SEBI-registered analyst. This idea is shared purely for educational and study purposes. Please do your own analysis before taking any trades.
#GRASIM #Grasim #PriceAction #VolumeProfile #SwingTrading #IndianStockMarket
GRASIM looks weak near the upper resistance zone. Price is struggling around **₹3,126–₹3,197**, and the structure suggests that a short-term downtrend may be starting.
**2. My View**
My view is bearish as long as GRASIM stays below **₹3,197**. The stock may enter a correction phase and move lower in the coming weeks.
**3. Invalidation**
This bearish study becomes invalid if GRASIM breaks **₹3,197** and gives a daily close above it.
**4. Risk-Reward**
Risk is limited above **₹3,197**, while downside potential is towards **₹2,778**, so the setup looks favorable for a short-side study.
**5. Target Point / Range**
Target zone: **₹2,778**
**6. Why It’s Good for Short**
This setup is good for short because price is near resistance, upside is limited unless ₹3,197 breaks, and the chart shows early signs of downside continuation.
**7. Time Period**
This is a **3-month correction view** on the daily chart.
I am not a SEBI-registered analyst. This idea is shared purely for educational and study purposes. Please do your own analysis before taking any trades.
#GRASIM #Grasim #PriceAction #VolumeProfile #SwingTrading #IndianStockMarket

I am not a SEBI-registered analyst. This post is only for educational study, not a buy/sell recommendation. Please do your own analysis, follow risk management, and consult a certified advisor if needed.
면책사항
해당 정보와 게시물은 금융, 투자, 트레이딩 또는 기타 유형의 조언이나 권장 사항으로 간주되지 않으며, 트레이딩뷰에서 제공하거나 보증하는 것이 아닙니다. 자세한 내용은 이용 약관을 참조하세요.
I am not a SEBI-registered analyst. This post is only for educational study, not a buy/sell recommendation. Please do your own analysis, follow risk management, and consult a certified advisor if needed.
면책사항
해당 정보와 게시물은 금융, 투자, 트레이딩 또는 기타 유형의 조언이나 권장 사항으로 간주되지 않으며, 트레이딩뷰에서 제공하거나 보증하는 것이 아닙니다. 자세한 내용은 이용 약관을 참조하세요.