
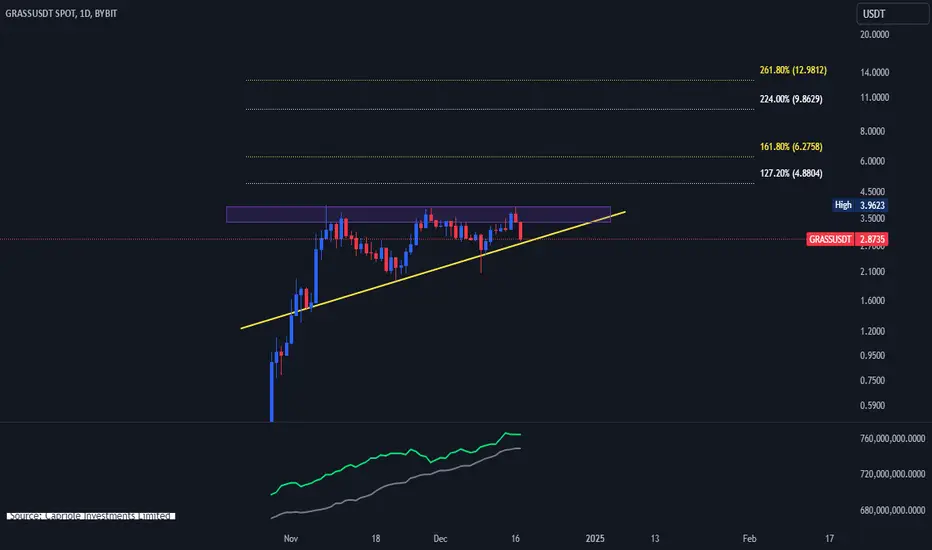
The GRASS/USDT chart shows a strong uptrend supported by a rising trendline (yellow) acting as dynamic support. Price is currently consolidating under a critical resistance zone (highlighted in purple), where sellers are active around 3.96 USDT. If the price holds above the trendline and breaks through this resistance, it could trigger a significant bullish move.
Using Fibonacci Extension levels, the potential upside targets are:
- 127.20% (4.88 USDT) as the first target,
- 161.80% (6.27 USDT) as the second target, and
- 261.80% (12.98 USDT) as the extended bullish target if momentum accelerates.
The rejection from the resistance combined with a 14.96% drop signals caution, but as long as the trendline holds, the bullish structure remains intact. A breakdown below the trendline, however, could shift momentum to bearish and invalidate this setup. Keep an eye on the trendline bounce for a potential breakout confirmation. 🚀 #GRASSUSDT #CryptoAnalysis #Uptrend #Trading
Using Fibonacci Extension levels, the potential upside targets are:
- 127.20% (4.88 USDT) as the first target,
- 161.80% (6.27 USDT) as the second target, and
- 261.80% (12.98 USDT) as the extended bullish target if momentum accelerates.
The rejection from the resistance combined with a 14.96% drop signals caution, but as long as the trendline holds, the bullish structure remains intact. A breakdown below the trendline, however, could shift momentum to bearish and invalidate this setup. Keep an eye on the trendline bounce for a potential breakout confirmation. 🚀 #GRASSUSDT #CryptoAnalysis #Uptrend #Trading

면책사항
해당 정보와 게시물은 금융, 투자, 트레이딩 또는 기타 유형의 조언이나 권장 사항으로 간주되지 않으며, 트레이딩뷰에서 제공하거나 보증하는 것이 아닙니다. 자세한 내용은 이용 약관을 참조하세요.
면책사항
해당 정보와 게시물은 금융, 투자, 트레이딩 또는 기타 유형의 조언이나 권장 사항으로 간주되지 않으며, 트레이딩뷰에서 제공하거나 보증하는 것이 아닙니다. 자세한 내용은 이용 약관을 참조하세요.