The Graph / Bitcoin
Hello!
Here we have Grt/Btc once again.
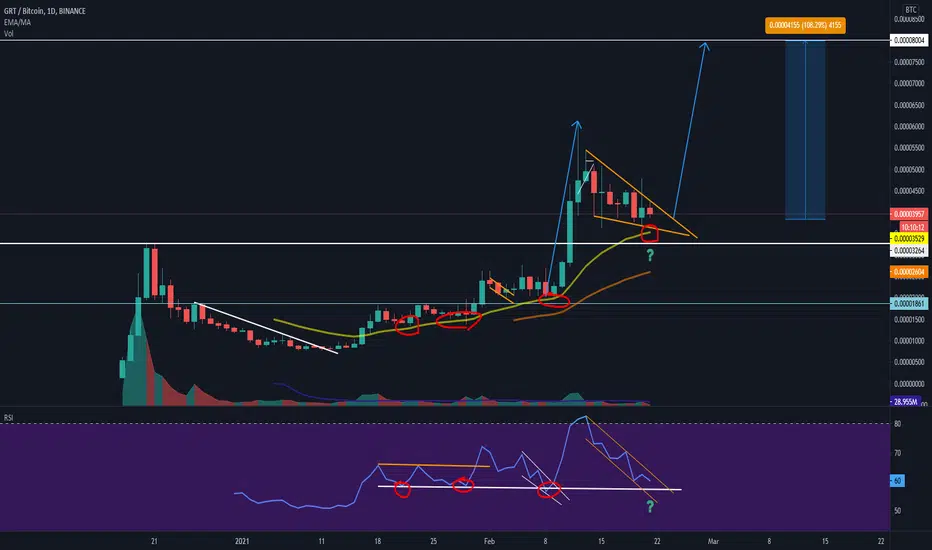
We can see from RSI vertical support line the 20 EMA bounces marked as red
Fourth time a charm or break downwards?
On RSI we can see similar price action like we did on previous break.
The Graph did come out on 17th of December 2020 but they have been working and helping others in the field much longer than that.
If you don't know the project I suggest to check it out.
I did make a analysis about the project already in January 26th
If you do take trades and are not holding for long term use stop loss.
Otherwise you will get your ass burned!
Jebu

관련 발행물
면책사항
해당 정보와 게시물은 금융, 투자, 트레이딩 또는 기타 유형의 조언이나 권장 사항으로 간주되지 않으며, 트레이딩뷰에서 제공하거나 보증하는 것이 아닙니다. 자세한 내용은 이용 약관을 참조하세요.
관련 발행물
면책사항
해당 정보와 게시물은 금융, 투자, 트레이딩 또는 기타 유형의 조언이나 권장 사항으로 간주되지 않으며, 트레이딩뷰에서 제공하거나 보증하는 것이 아닙니다. 자세한 내용은 이용 약관을 참조하세요.