
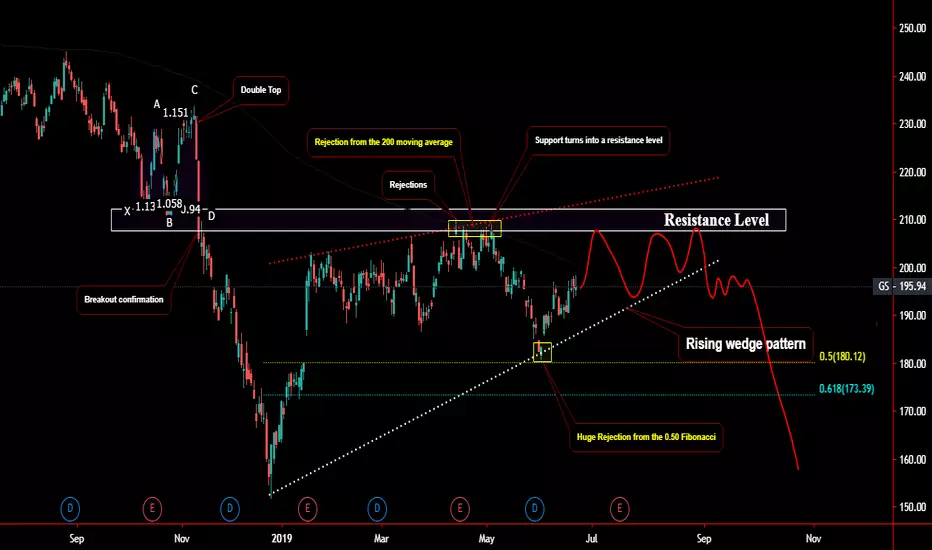
As we can see on the Daily chart the price keep moving to the downside we have a double top with a break confirmation causes a huge drop into 155.0, huge continuation to the upside into the previous low the price touched and reject each times to turns the previous support into a new resistance level with crossing the 200 MA then the price drop again and reject from the 0.50 fib level the price could push higher again into the resistance before drop again as a sign to short we are waiting a breakout confirmation of the lower low of the rising wedge patter

면책사항
해당 정보와 게시물은 금융, 투자, 트레이딩 또는 기타 유형의 조언이나 권장 사항으로 간주되지 않으며, 트레이딩뷰에서 제공하거나 보증하는 것이 아닙니다. 자세한 내용은 이용 약관을 참조하세요.
면책사항
해당 정보와 게시물은 금융, 투자, 트레이딩 또는 기타 유형의 조언이나 권장 사항으로 간주되지 않으며, 트레이딩뷰에서 제공하거나 보증하는 것이 아닙니다. 자세한 내용은 이용 약관을 참조하세요.