
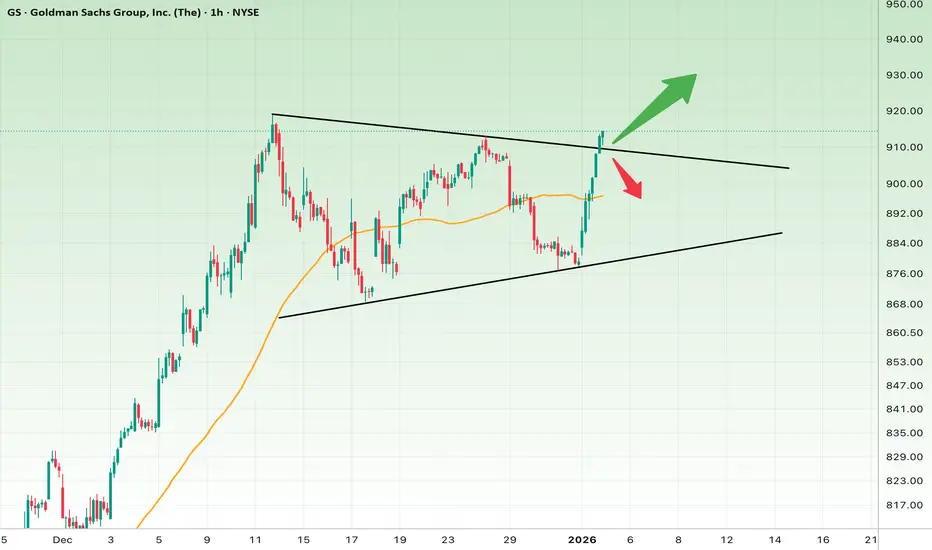
GS price is currently moving inside a Rising Wedge pattern — a structure that is inherently risky and often associated with corrective moves, especially near the upper boundary.
At the moment:
• Price has made a strong push into the upper trendline
• The moving average (orange line) has been reclaimed as support
• However, there is no confirmed and sustained breakout above resistance yet
This places the market at a critical smart-money decision zone.
Trading Scenarios
Bullish Scenario (Valid Breakout)
If price:
• Holds and closes above the 915–920 zone
• Shows acceptance above the wedge (no deep pullback)
Then a confirmed breakout is in play.
Upside Targets:
930 → 950
Invalidation / Stop-loss:
Hourly close below 905
Bearish Scenario (Fake Breakout / Rejection)
If price:
• Fails to hold above the upper trendline
• Falls back inside the wedge structure
This would activate a classic fake breakout scenario.
Downside Targets:
895 → 880 (wedge support)
Short invalidation:
Hourly close above 920
Structural / Behavioral View
• The sharp upside move may represent a liquidity grab
• Rising wedges near highs often resolve to the downside
• Still, the breakout candle strength suggests sellers are currently weak
Key takeaway:
Confirmation matters more than prediction
Fundamental Context (Brief)
Goldman Sachs continues to benefit from:
• Strong trading and investment banking revenue
• Increased market volatility
• A dominant position in capital markets
That said, the stock is trading at elevated valuation levels, making short-term pullbacks completely normal.
Final Summary
GS is sitting right at a major resistance zone:
• Acceptance above 920 → bullish continuation
• Rejection → controlled correction
Best strategy:
• Trade after confirmation, not inside the pattern
At the moment:
• Price has made a strong push into the upper trendline
• The moving average (orange line) has been reclaimed as support
• However, there is no confirmed and sustained breakout above resistance yet
This places the market at a critical smart-money decision zone.
Trading Scenarios
Bullish Scenario (Valid Breakout)
If price:
• Holds and closes above the 915–920 zone
• Shows acceptance above the wedge (no deep pullback)
Then a confirmed breakout is in play.
Upside Targets:
930 → 950
Invalidation / Stop-loss:
Hourly close below 905
Bearish Scenario (Fake Breakout / Rejection)
If price:
• Fails to hold above the upper trendline
• Falls back inside the wedge structure
This would activate a classic fake breakout scenario.
Downside Targets:
895 → 880 (wedge support)
Short invalidation:
Hourly close above 920
Structural / Behavioral View
• The sharp upside move may represent a liquidity grab
• Rising wedges near highs often resolve to the downside
• Still, the breakout candle strength suggests sellers are currently weak
Key takeaway:
Confirmation matters more than prediction
Fundamental Context (Brief)
Goldman Sachs continues to benefit from:
• Strong trading and investment banking revenue
• Increased market volatility
• A dominant position in capital markets
That said, the stock is trading at elevated valuation levels, making short-term pullbacks completely normal.
Final Summary
GS is sitting right at a major resistance zone:
• Acceptance above 920 → bullish continuation
• Rejection → controlled correction
Best strategy:
• Trade after confirmation, not inside the pattern

면책사항
해당 정보와 게시물은 금융, 투자, 트레이딩 또는 기타 유형의 조언이나 권장 사항으로 간주되지 않으며, 트레이딩뷰에서 제공하거나 보증하는 것이 아닙니다. 자세한 내용은 이용 약관을 참조하세요.
면책사항
해당 정보와 게시물은 금융, 투자, 트레이딩 또는 기타 유형의 조언이나 권장 사항으로 간주되지 않으며, 트레이딩뷰에서 제공하거나 보증하는 것이 아닙니다. 자세한 내용은 이용 약관을 참조하세요.