
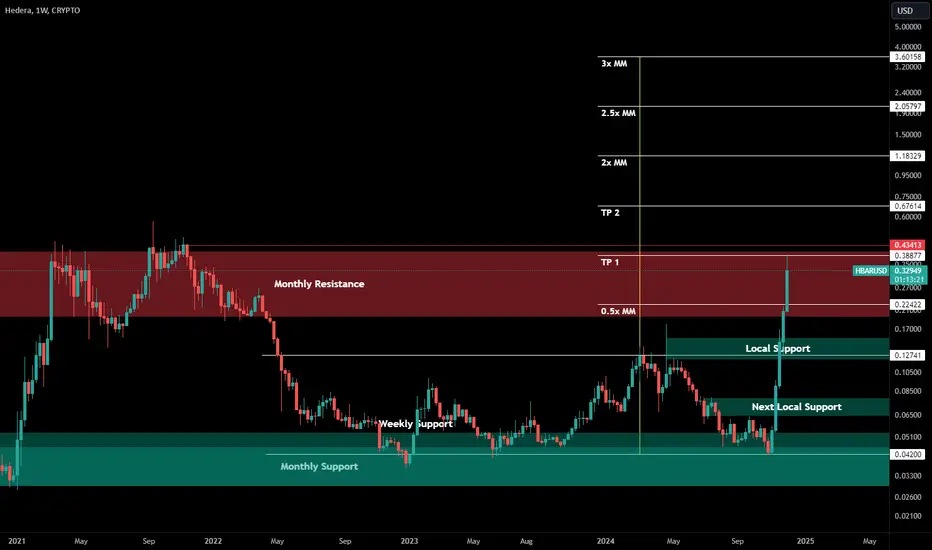
Publishing a monthly support and resistance chart, a weekly view of that chart - with targets - that I've been sharing for a while, so others can follow along.
This in addition to the parallel S/R chart that is already published here:

With an updated snapshot of it here (targets adjusted for where it broke out):

Possible areas of local support if any dips below monthly resistance are marked on the chart.
Hope this helps if you are following HBARUSD
This in addition to the parallel S/R chart that is already published here:
With an updated snapshot of it here (targets adjusted for where it broke out):
Possible areas of local support if any dips below monthly resistance are marked on the chart.
Hope this helps if you are following HBARUSD

면책사항
해당 정보와 게시물은 금융, 투자, 트레이딩 또는 기타 유형의 조언이나 권장 사항으로 간주되지 않으며, 트레이딩뷰에서 제공하거나 보증하는 것이 아닙니다. 자세한 내용은 이용 약관을 참조하세요.
면책사항
해당 정보와 게시물은 금융, 투자, 트레이딩 또는 기타 유형의 조언이나 권장 사항으로 간주되지 않으며, 트레이딩뷰에서 제공하거나 보증하는 것이 아닙니다. 자세한 내용은 이용 약관을 참조하세요.