
HBAR analysis
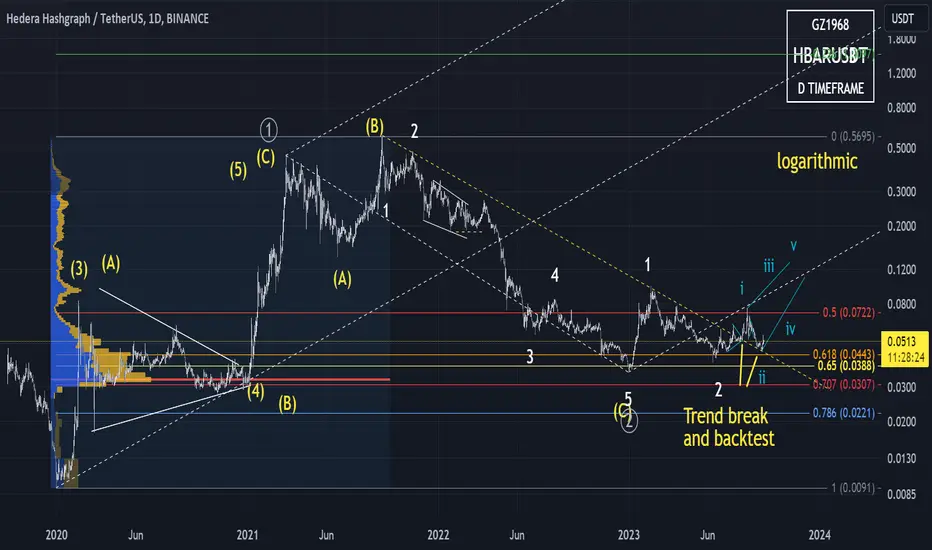
Multi-year trend line has been backtested.
12 EMA + Vegas chart indicator not showing buy yet (indicators lag)
Daily count shown. Notice trend line (log) has been broken and backtested.
8 hr count is tricky - I suspect HBAR is bullish and starting a diagonal. If I'm wrong, well then that sucks. 😆
1 hr count - in corrective mode right now. I show some ideas.
Multi-year trend line has been backtested.
12 EMA + Vegas chart indicator not showing buy yet (indicators lag)
Daily count shown. Notice trend line (log) has been broken and backtested.
8 hr count is tricky - I suspect HBAR is bullish and starting a diagonal. If I'm wrong, well then that sucks. 😆
1 hr count - in corrective mode right now. I show some ideas.
노트
Multi-year trend line shows a strong support and backtest completed노트
Remember, indicators lag. HBAR may be bullish already.노트
8 hr chart. The wave forms are corrective. This makes me thing either a diagonal is forming, or I'm wrong and some greater corrective structure is in play. I show the bullish diagonal scenario.노트
I show possible ideas on the 1 hr. So you can prepare to enter and make money.노트
If you wish to enter HBAR long here is a setup.노트
HBAR is presenting an excellent long entry. The golden zone (0.618 to 0.65 fibonacci) is the obvious entry point. There is a nice resistance line at the 0.65. It is possible that the 0.786 could be tagged. I show two possible channels.
면책사항
해당 정보와 게시물은 금융, 투자, 트레이딩 또는 기타 유형의 조언이나 권장 사항으로 간주되지 않으며, 트레이딩뷰에서 제공하거나 보증하는 것이 아닙니다. 자세한 내용은 이용 약관을 참조하세요.
면책사항
해당 정보와 게시물은 금융, 투자, 트레이딩 또는 기타 유형의 조언이나 권장 사항으로 간주되지 않으며, 트레이딩뷰에서 제공하거나 보증하는 것이 아닙니다. 자세한 내용은 이용 약관을 참조하세요.