
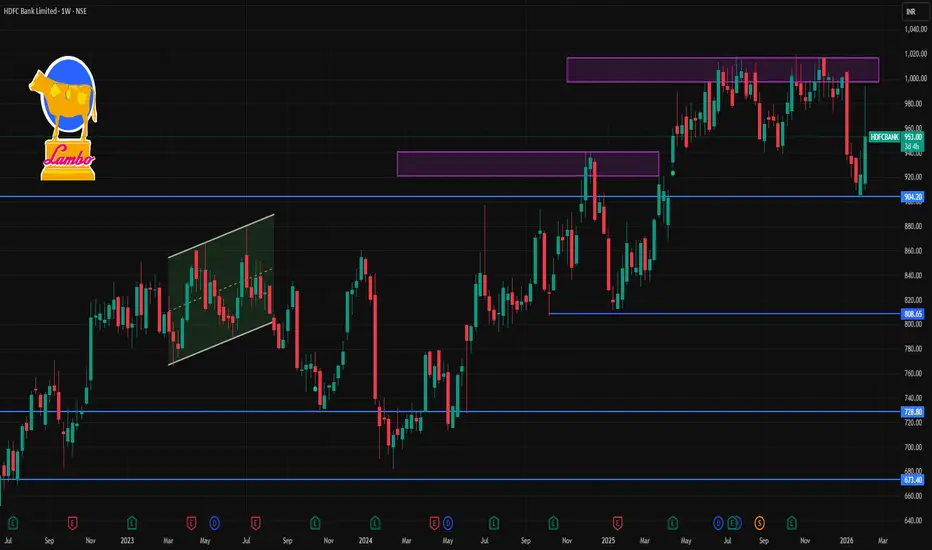
📌 Current Reference Price (approx): ~₹920–₹950 range recently after weekly sessions.
📉 Weekly Pivot & Key Levels (based on weekly pivot analysis)
(derived from pivot calculations for the weekly timeframe)
Pivot Point (Weekly)
Weekly Pivot (Central): ~₹945.47
Resistance Levels (Weekly)
R1: ~₹961.68
R2: ~₹981.92
R3: ~₹~1,000+ (higher band extensions)
Support Levels (Weekly)
S1: ~₹925.23
S2: ~₹909.02
S3: ~₹888.78
(Lower supports if breakdown continues)
These levels are pivot‑based and often watched by traders for entry/exit or stop placements.
🔎 Additional Reference Points
📊 52‑Week Range
High: ~₹1,020.50
Low: ~₹830.55
This gives broader context on where the weekly levels sit within the yearly trend.
📈 Recent Weekly Price Action
Weekly charts show HDFC Bank stock has been trading below its recent highs with some volatility and is within a range on weekly bars — this means weekly support/resistance bands can act as possible bounce zones or breakout triggers.
📌 Weekly Trading Bias and Key Zones to Watch
Bullish Scenario (weekly close above pivot):
A weekly close above ~₹961–₹965 may open momentum toward ₹980‑₹1,000+ zone.
Neutral / Range:
Price stuck between ~₹925 and ₹961 suggests sideways consolidation.
Bearish Scenario (weekly break below support):
Weekly close below ~₹909–₹888 could open deeper downside toward the 52‑week low zone near ₹830‑₹850.
⚠️ Notes
These levels are technical references, not buy/sell advice.
Market news, volume, macro cues & overall Bank Nifty moves can influence weekly levels significantly.
Always consider your risk tolerance and use stop‑loss orders appropriately.

Contact Knowledgehub for a detailed consultation: Dm on WhatsApp: [wa.link/a2o0kz]-
Phone No: [+91 93102 26243]-
Email: [tradingviewknowledgehub@gmail.com]---
-- Let’s achieve success together!
Phone No: [+91 93102 26243]-
Email: [tradingviewknowledgehub@gmail.com]---
-- Let’s achieve success together!
관련 발행물
면책사항
해당 정보와 게시물은 금융, 투자, 트레이딩 또는 기타 유형의 조언이나 권장 사항으로 간주되지 않으며, 트레이딩뷰에서 제공하거나 보증하는 것이 아닙니다. 자세한 내용은 이용 약관을 참조하세요.