
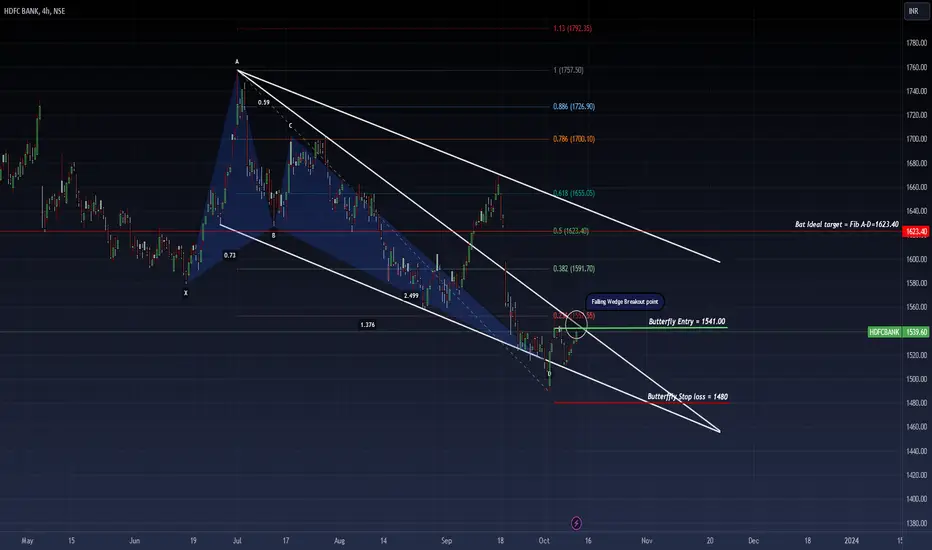
The idea here is about HDFC Bank.
Mentioned below are the points to be considered
Points as per TA on a Daily & 4H Chart:
1. Awaiting break out of Falling wedge.
2. Butterfly Pattern completed with entry point confirmed.
3. Waiting for close above 20 EMA = 1550 on 1D chart.
4. RSI is at 44.30 on a Daily Chart.
5. MACD crossed above signal line on 11th Sept 2023.
6. Hull Moving Average is a Buy Signal on Daily & weekly chart.
7. Price may retest the breakout point.
Projected target as per Butterfly Harmonic pattern provided in the chart.
Stop Loss: provided on chart.
Disclaimer: “The above is an idea only and not any kind of financial or investment advice. So please do your own DD (Due Diligence) before any kind of investment”.
Cheers.
노트
Broken out...

면책사항
해당 정보와 게시물은 금융, 투자, 트레이딩 또는 기타 유형의 조언이나 권장 사항으로 간주되지 않으며, 트레이딩뷰에서 제공하거나 보증하는 것이 아닙니다. 자세한 내용은 이용 약관을 참조하세요.
면책사항
해당 정보와 게시물은 금융, 투자, 트레이딩 또는 기타 유형의 조언이나 권장 사항으로 간주되지 않으며, 트레이딩뷰에서 제공하거나 보증하는 것이 아닙니다. 자세한 내용은 이용 약관을 참조하세요.