
01-12
Daily chart of HDFCBANK1!
LTP: 1638.25
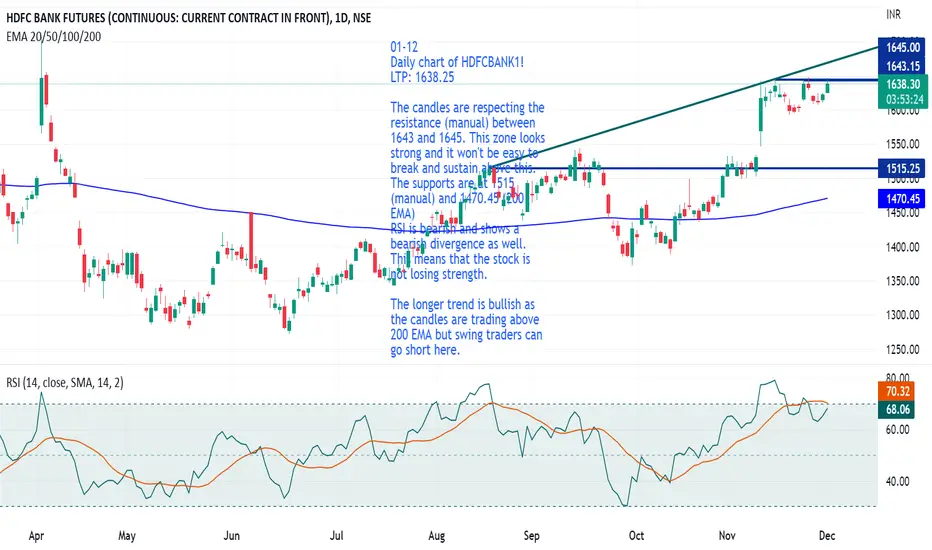
The candles are respecting the resistance (manual) between 1643 and 1645. This zone looks strong and it won't be easy to break and sustain above this.
The supports are at 1515 (manual) and 1470.45 (200 EMA)
RSI is bearish and shows a bearish divergence as well. This means that the stock is not losing strength.
The longer trend is bullish as the candles are trading above 200 EMA but swing traders can go short here.

면책사항
해당 정보와 게시물은 금융, 투자, 트레이딩 또는 기타 유형의 조언이나 권장 사항으로 간주되지 않으며, 트레이딩뷰에서 제공하거나 보증하는 것이 아닙니다. 자세한 내용은 이용 약관을 참조하세요.
면책사항
해당 정보와 게시물은 금융, 투자, 트레이딩 또는 기타 유형의 조언이나 권장 사항으로 간주되지 않으며, 트레이딩뷰에서 제공하거나 보증하는 것이 아닙니다. 자세한 내용은 이용 약관을 참조하세요.