롱
HEX 3D CHART- Is the Bottom In?
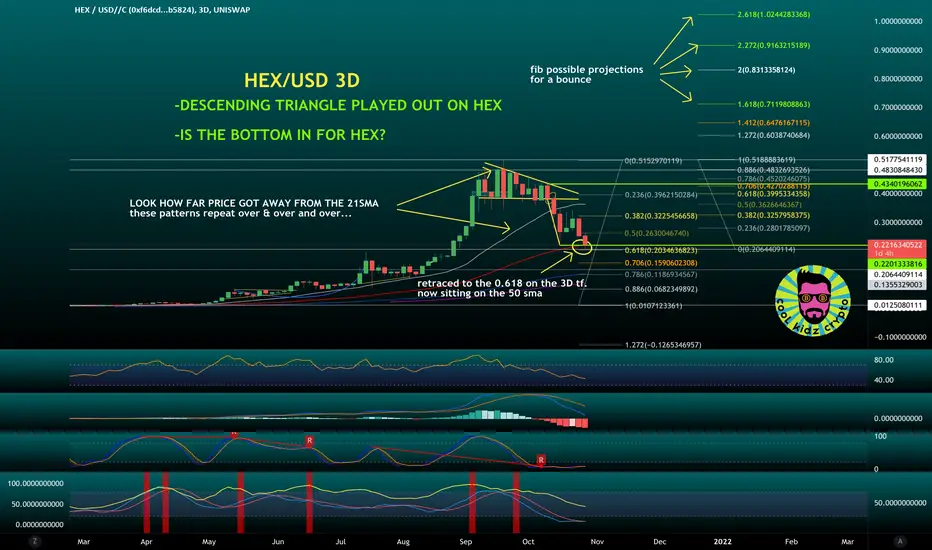
HEX 3D CHART W/ ANALYSIS
⚪️ANALYSIS
Descending triangle played out to a tee. Meas. Move to the 0.618. Investors like to play these golden pockets for area to pick up retracements. Fib possible projections are outined on the chart for a bounce if HEX break ATH.
SRSI Low
MACD Low
FIB Retracement to the 0.618
*Note about the bottom indicator.
Would like to see the YELLOW line (regular Stoch) dip to oversold region as well but not necessary. if all 3 indicators get to a “bundle” under the oversole area + it throws a MTF (multi time Frame) stoch buy (green buy signal) then on these higher time frames it can really be a great sign for reversal.
We are simply looking for as many points of colfluence as we can find. That what gives us an egde.
DISCLAIMER: NOT FINANCIAL ADVICE
FOR EDUCATIONAL PURPOSES ONLY

면책사항
해당 정보와 게시물은 금융, 투자, 트레이딩 또는 기타 유형의 조언이나 권장 사항으로 간주되지 않으며, 트레이딩뷰에서 제공하거나 보증하는 것이 아닙니다. 자세한 내용은 이용 약관을 참조하세요.
면책사항
해당 정보와 게시물은 금융, 투자, 트레이딩 또는 기타 유형의 조언이나 권장 사항으로 간주되지 않으며, 트레이딩뷰에서 제공하거나 보증하는 것이 아닙니다. 자세한 내용은 이용 약관을 참조하세요.