
29-11
Daily chart of HINDPETRO1!
LTP: 238.85
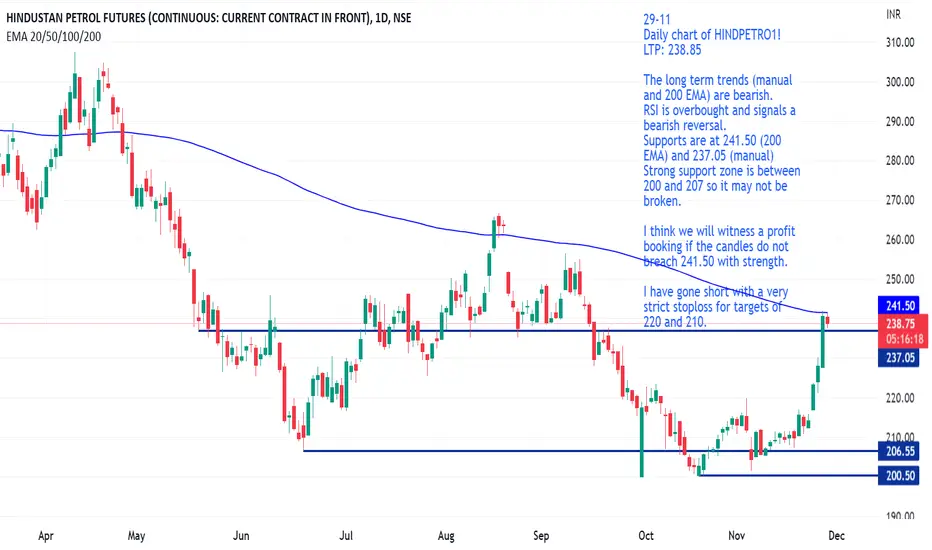
The long term trends (manual and 200 EMA) are bearish.
RSI is overbought and signals a bearish reversal.
Supports are at 241.50 (200 EMA) and 237.05 (manual)
Strong support zone is between 200 and 207 so it may not be broken.
I think we will witness a profit booking if the candles do not breach 241.50 with strength.
I have gone short with a very strict stoploss for targets of 220 and 210.
Daily chart of HINDPETRO1!
LTP: 238.85
The long term trends (manual and 200 EMA) are bearish.
RSI is overbought and signals a bearish reversal.
Supports are at 241.50 (200 EMA) and 237.05 (manual)
Strong support zone is between 200 and 207 so it may not be broken.
I think we will witness a profit booking if the candles do not breach 241.50 with strength.
I have gone short with a very strict stoploss for targets of 220 and 210.

면책사항
해당 정보와 게시물은 금융, 투자, 트레이딩 또는 기타 유형의 조언이나 권장 사항으로 간주되지 않으며, 트레이딩뷰에서 제공하거나 보증하는 것이 아닙니다. 자세한 내용은 이용 약관을 참조하세요.
면책사항
해당 정보와 게시물은 금융, 투자, 트레이딩 또는 기타 유형의 조언이나 권장 사항으로 간주되지 않으며, 트레이딩뷰에서 제공하거나 보증하는 것이 아닙니다. 자세한 내용은 이용 약관을 참조하세요.