
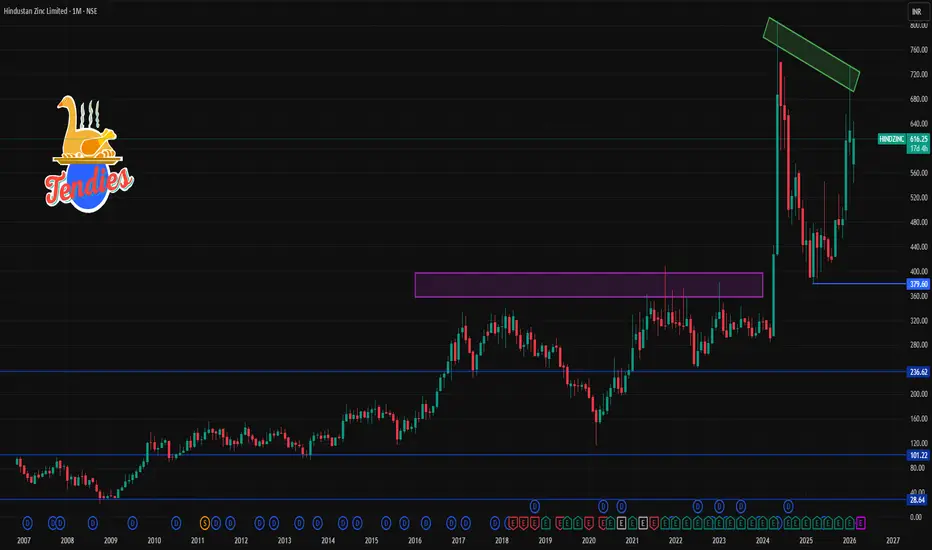
📊 Current context (as of mid-Feb 2026):
• The stock is trading around ~₹615–₹630 levels on NSE/BSE.
📈 Resistance (Upside Targets)
1. ₹615–₹617 – First resistance (short-term)
2. ₹621–₹622 – Second resistance zone
3. ₹630–₹632 – Third resistance / next hurdle
4. Higher near ₹650+ – longer-term barrier if momentum strengthens (based on recent trading structure)
Interpretation:
If price maintains above ₹615, the more bullish range toward ₹621–₹632 becomes likely, with extensions possible above ₹640 only on strong trend continuation.
📉 Support (Downside Levels)
1. ₹598–₹600 – 1st support (near pivot underside)
2. ₹587–₹590 – 2nd support band
3. ₹581–₹585 – broader base support zone
4. ₹570–₹575 – deeper support if market weakens significantly
Interpretation:
A break below ₹598 increases chance of retesting ₹587–₹585. Stronger support around ₹570–₹575 is deeper but important for broader corrective setups.
• The stock is trading around ~₹615–₹630 levels on NSE/BSE.
📈 Resistance (Upside Targets)
1. ₹615–₹617 – First resistance (short-term)
2. ₹621–₹622 – Second resistance zone
3. ₹630–₹632 – Third resistance / next hurdle
4. Higher near ₹650+ – longer-term barrier if momentum strengthens (based on recent trading structure)
Interpretation:
If price maintains above ₹615, the more bullish range toward ₹621–₹632 becomes likely, with extensions possible above ₹640 only on strong trend continuation.
📉 Support (Downside Levels)
1. ₹598–₹600 – 1st support (near pivot underside)
2. ₹587–₹590 – 2nd support band
3. ₹581–₹585 – broader base support zone
4. ₹570–₹575 – deeper support if market weakens significantly
Interpretation:
A break below ₹598 increases chance of retesting ₹587–₹585. Stronger support around ₹570–₹575 is deeper but important for broader corrective setups.

Contact Knowledgehub for a detailed consultation: Dm on WhatsApp: [wa.link/a2o0kz]-
Phone No: [+91 93102 26243]-
Email: [tradingviewknowledgehub@gmail.com]---
-- Let’s achieve success together!
Phone No: [+91 93102 26243]-
Email: [tradingviewknowledgehub@gmail.com]---
-- Let’s achieve success together!
관련 발행물
면책사항
해당 정보와 게시물은 금융, 투자, 트레이딩 또는 기타 유형의 조언이나 권장 사항으로 간주되지 않으며, 트레이딩뷰에서 제공하거나 보증하는 것이 아닙니다. 자세한 내용은 이용 약관을 참조하세요.
Contact Knowledgehub for a detailed consultation: Dm on WhatsApp: [wa.link/a2o0kz]-
Phone No: [+91 93102 26243]-
Email: [tradingviewknowledgehub@gmail.com]---
-- Let’s achieve success together!
Phone No: [+91 93102 26243]-
Email: [tradingviewknowledgehub@gmail.com]---
-- Let’s achieve success together!
관련 발행물
면책사항
해당 정보와 게시물은 금융, 투자, 트레이딩 또는 기타 유형의 조언이나 권장 사항으로 간주되지 않으며, 트레이딩뷰에서 제공하거나 보증하는 것이 아닙니다. 자세한 내용은 이용 약관을 참조하세요.