
HMPRO | Wave Projection | Complex Inv. Head & Shoulders Breakout
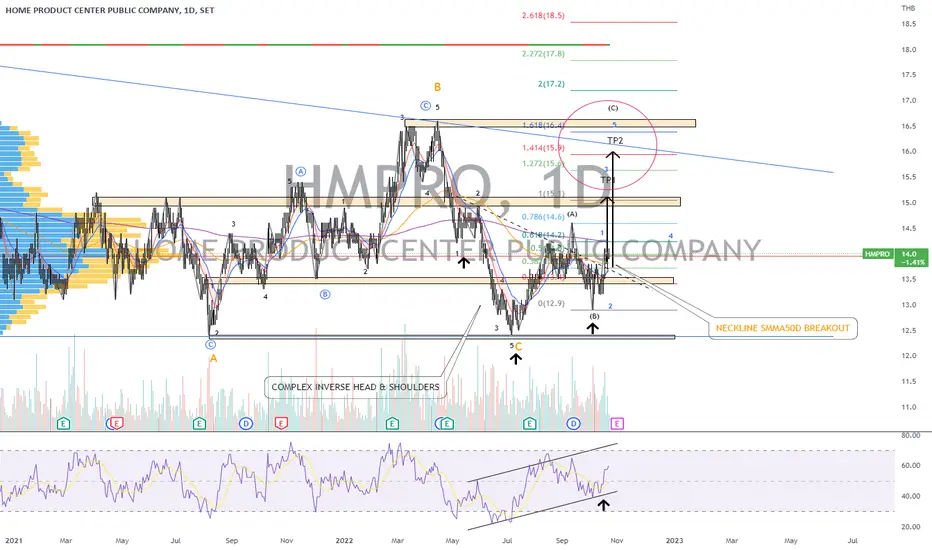
Price action and chart pattern trading setup
> A possible bullish uptrend ABC scenario with complex inverse head & shoulders pattern with SMMA50D as its neckline BREAKOUT!
> The candlestick pattern is consolidating just above the breakout area which possibly retest its neckline next week before price push higher.
> Entry @ B1: PULLBACK retesting neckline within area of candlestick consolidation B2 @ breakout as follow buy.
> Target: Inverse head & shoulders T1 is fibo 1.0 extension and T2 just below 1.618 ext. zone + 12 - 18%
> Stoploss: right shoulder zone - 7 - 8%
> Risk reward ratio: 1.5 - 2: 1
> Indicator: RSI > 60 bullish channel and breakout MA
> The key fundamental analysis found that this coming high season after Thailand major flooding could trigger a boost in revenue and profit in upcoming Q4 company performance.
Always trade with affordable risk and respect your stoploss.

면책사항
해당 정보와 게시물은 금융, 투자, 트레이딩 또는 기타 유형의 조언이나 권장 사항으로 간주되지 않으며, 트레이딩뷰에서 제공하거나 보증하는 것이 아닙니다. 자세한 내용은 이용 약관을 참조하세요.
면책사항
해당 정보와 게시물은 금융, 투자, 트레이딩 또는 기타 유형의 조언이나 권장 사항으로 간주되지 않으며, 트레이딩뷰에서 제공하거나 보증하는 것이 아닙니다. 자세한 내용은 이용 약관을 참조하세요.