
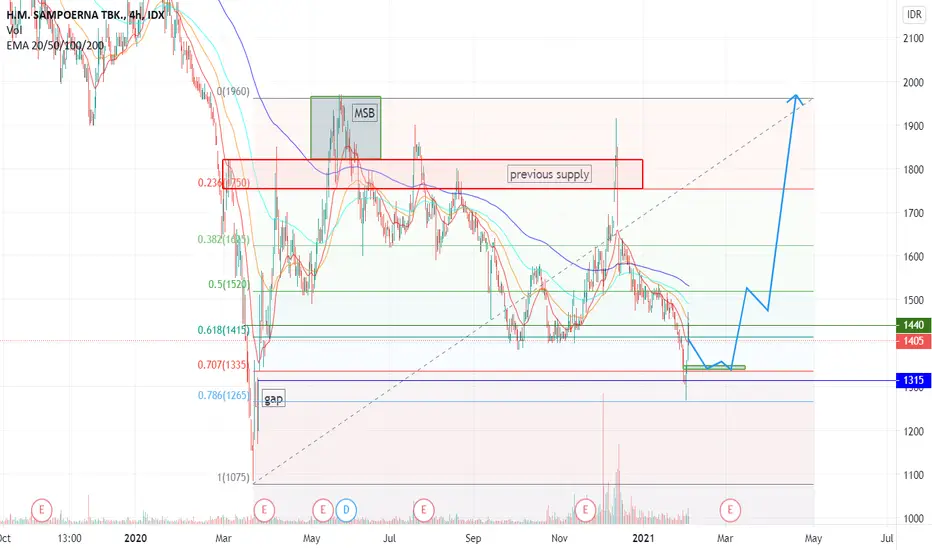
The retracement of IDX gives us second opportunity to grab HMSP.
Shown here is a 4 hour timeframe analysis
Several data to support this analysis (based on multiple timeframe)
1. The downside to the level of 1270 close the previous gap seen in 1 Hour TF and now closed.
2. Market structure breaking previous supply zone seen in 4 hr tf and 1d TF happened in May 2020 and now requires a retracement
3. Detecting the level of retracement, I drew fibonacci and found the fibo 0.786 match with 1270.
Having tapped 1270, we could see a major buying power into the stock.
Conclusion
- Set a buy order at the level 1350 as this represents a healthy pullback to a formed breaker
- slowly buying, to wait for the movement that is upside
PUMP IT!
Disc On
Shown here is a 4 hour timeframe analysis
Several data to support this analysis (based on multiple timeframe)
1. The downside to the level of 1270 close the previous gap seen in 1 Hour TF and now closed.
2. Market structure breaking previous supply zone seen in 4 hr tf and 1d TF happened in May 2020 and now requires a retracement
3. Detecting the level of retracement, I drew fibonacci and found the fibo 0.786 match with 1270.
Having tapped 1270, we could see a major buying power into the stock.
Conclusion
- Set a buy order at the level 1350 as this represents a healthy pullback to a formed breaker
- slowly buying, to wait for the movement that is upside
PUMP IT!
Disc On
노트
Get along the train before its too late노트
nice bounce on 1300, as predicted
면책사항
해당 정보와 게시물은 금융, 투자, 트레이딩 또는 기타 유형의 조언이나 권장 사항으로 간주되지 않으며, 트레이딩뷰에서 제공하거나 보증하는 것이 아닙니다. 자세한 내용은 이용 약관을 참조하세요.
면책사항
해당 정보와 게시물은 금융, 투자, 트레이딩 또는 기타 유형의 조언이나 권장 사항으로 간주되지 않으며, 트레이딩뷰에서 제공하거나 보증하는 것이 아닙니다. 자세한 내용은 이용 약관을 참조하세요.