
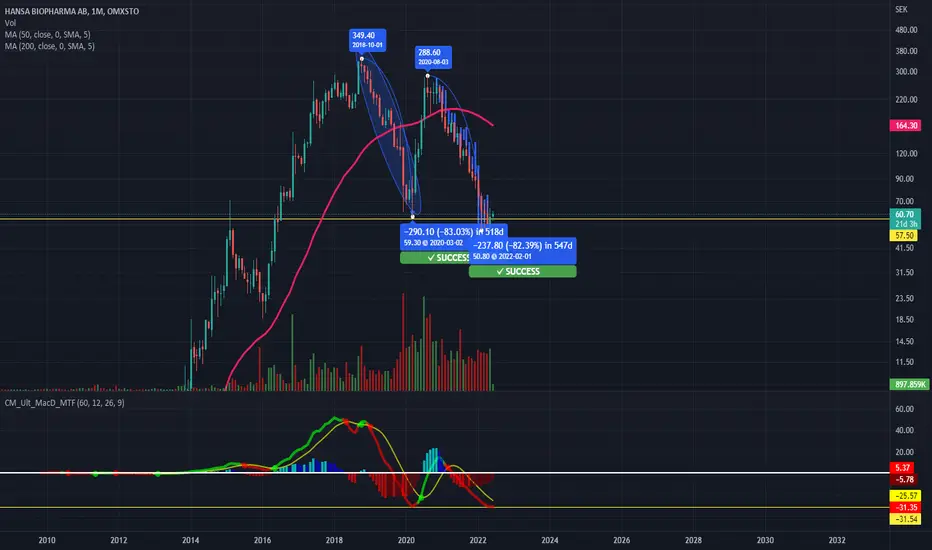
I don't know if this is a valid method but it caught my eye that the bars pattern of the last dowtrend and the downtrend before are very alike. Both with a downmove of around 83%. On the MACD it also moved up at the same level so could this mean something?
Could this be a valid theory or am I just trippin?
Not finncial advice in case this wasn't already clear :)
Could this be a valid theory or am I just trippin?
Not finncial advice in case this wasn't already clear :)

면책사항
해당 정보와 게시물은 금융, 투자, 트레이딩 또는 기타 유형의 조언이나 권장 사항으로 간주되지 않으며, 트레이딩뷰에서 제공하거나 보증하는 것이 아닙니다. 자세한 내용은 이용 약관을 참조하세요.
면책사항
해당 정보와 게시물은 금융, 투자, 트레이딩 또는 기타 유형의 조언이나 권장 사항으로 간주되지 않으며, 트레이딩뷰에서 제공하거나 보증하는 것이 아닙니다. 자세한 내용은 이용 약관을 참조하세요.