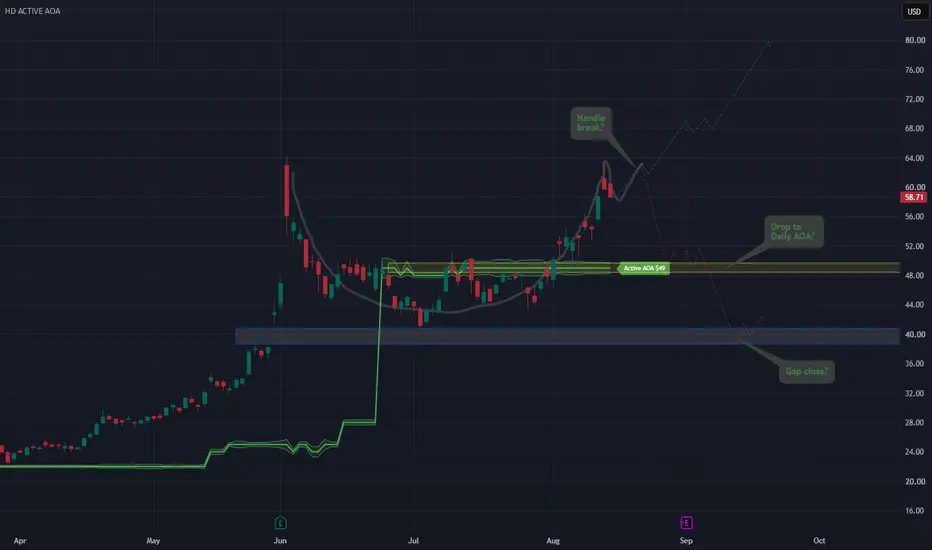
 HPE is sitting in an interesting spot on the daily chart.
Right now, I don’t see sideways chop as the most compelling scenario. Price is sitting near a decision area where I think one of two broader paths could start developing.
Bullish possibility:
The current structure develops into a valid cup-and-handle continuation and price breaks higher.
But I would not call the pattern complete yet. For me, that requires a clear break and acceptance above the handle area, not just a brief move through it.
Bearish possibility:
The handle fails and price rotates back toward the ~48–50 Daily AOA zone.
If that area eventually fails as well, the lower ~39–41 gap zone becomes much more relevant.
What makes this chart interesting is that both directions potentially have room to travel before reaching the next major decision area.
That does not mean I’m choosing a direction yet.
This daily chart is only the first step.
The daily timeframe helps me identify the larger structure, AOAs, gaps, and possible paths. Next, I’ll move down into the smaller timeframes and look at how price is actually behaving inside these areas.
That is where we start asking whether either scenario is becoming tradable for the coming week.
The process is:
Higher timeframe → identify the battlefield.
Lower timeframe → look for evidence of which side is actually winning.
If neither side gives us enough evidence, then there may simply be no trade.
The dotted paths are possibilities, not forecasts.
Preparation > Prediction.

면책사항
해당 정보와 게시물은 금융, 투자, 트레이딩 또는 기타 유형의 조언이나 권장 사항으로 간주되지 않으며, 트레이딩뷰에서 제공하거나 보증하는 것이 아닙니다. 자세한 내용은 이용 약관을 참조하세요.
면책사항
해당 정보와 게시물은 금융, 투자, 트레이딩 또는 기타 유형의 조언이나 권장 사항으로 간주되지 않으며, 트레이딩뷰에서 제공하거나 보증하는 것이 아닙니다. 자세한 내용은 이용 약관을 참조하세요.