
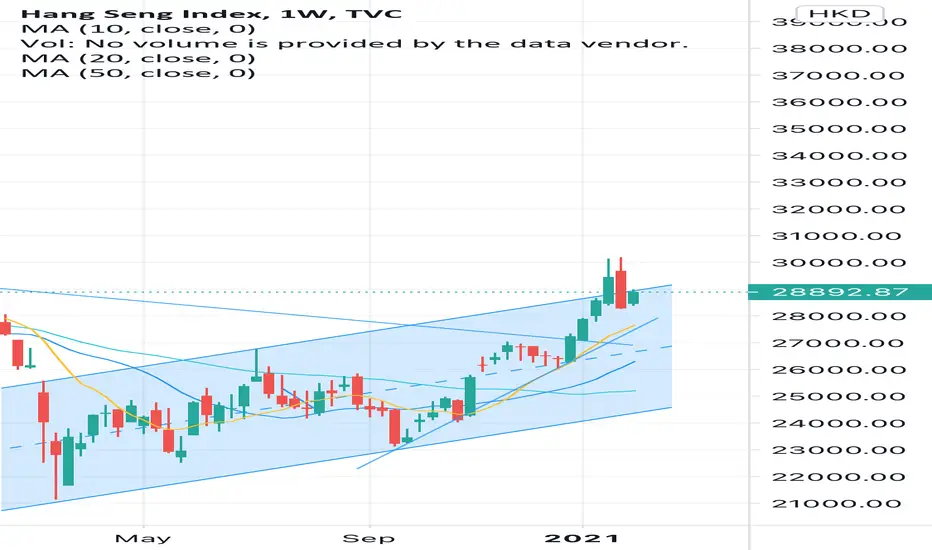
After the breakthrough of the Long-term downtrend in Q4 2020, HSI would keep in ascending channel mid-term view. In Weekly chart, all 10/20/50 moving averages are in bullish moving average patten. In short terms, the uptrend started from Sep 2020, move to 27500 on next week , it would be a very strong support.

면책사항
해당 정보와 게시물은 금융, 투자, 트레이딩 또는 기타 유형의 조언이나 권장 사항으로 간주되지 않으며, 트레이딩뷰에서 제공하거나 보증하는 것이 아닙니다. 자세한 내용은 이용 약관을 참조하세요.
면책사항
해당 정보와 게시물은 금융, 투자, 트레이딩 또는 기타 유형의 조언이나 권장 사항으로 간주되지 않으며, 트레이딩뷰에서 제공하거나 보증하는 것이 아닙니다. 자세한 내용은 이용 약관을 참조하세요.