
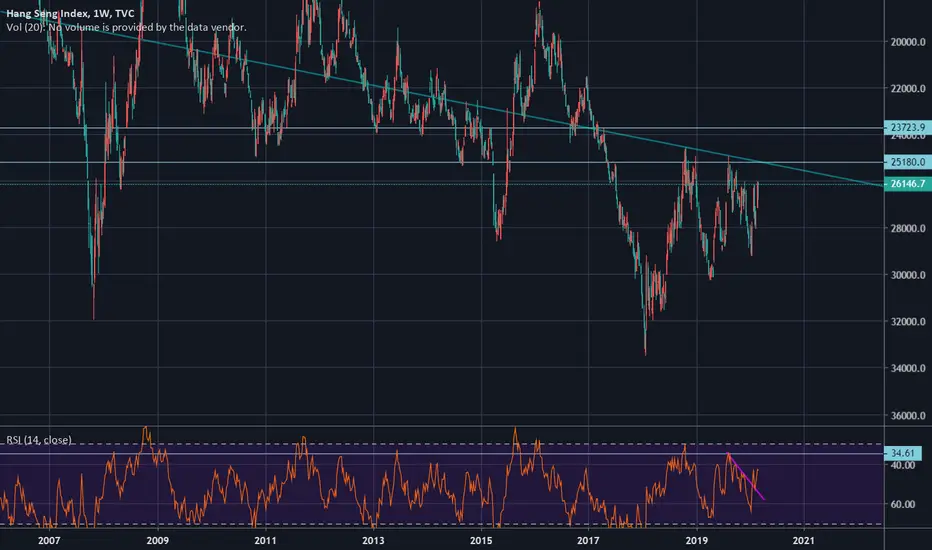
While everyone is trying catch a bottom, the HSI Inverted Weekly Chart gives a bearish view on the Hang Seng Index.
The candles from the last three weeks are bearish:
1) A Reversal Red Candle
2) A Gap with Solid Long Red Candle
3) Green Candle with Long Wick
In the coming two weeks it may hit and test the weekly support line at around 25180.
Let's see how the market reacts to the support level.
If selling is strong, it may break below 24000.

면책사항
해당 정보와 게시물은 금융, 투자, 트레이딩 또는 기타 유형의 조언이나 권장 사항으로 간주되지 않으며, 트레이딩뷰에서 제공하거나 보증하는 것이 아닙니다. 자세한 내용은 이용 약관을 참조하세요.
면책사항
해당 정보와 게시물은 금융, 투자, 트레이딩 또는 기타 유형의 조언이나 권장 사항으로 간주되지 않으며, 트레이딩뷰에서 제공하거나 보증하는 것이 아닙니다. 자세한 내용은 이용 약관을 참조하세요.