
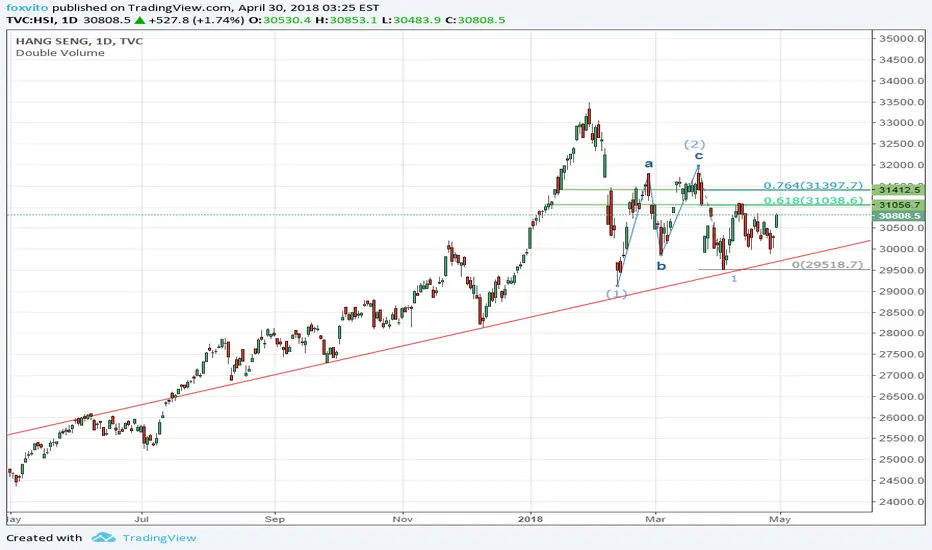
As stated in the diagram. HSI might go downward as the fibonacci ratio match. The target of the wave may be 26000.
If we see any strong resistance at 31000 or 31400 in this week. It is very likely that HSI will follow this trend to move
If we see any strong resistance at 31000 or 31400 in this week. It is very likely that HSI will follow this trend to move
매매 수동청산
Unfortunately, HSI cannot stand on 0.764 (around 31400). See it immediately drop under it the next day.As now the RSI is very low and comes to a critical support line. I close the position first. Wait and see if it is a rebound or a new raising wave.
거래청산: 스탑 닿음

면책사항
해당 정보와 게시물은 금융, 투자, 트레이딩 또는 기타 유형의 조언이나 권장 사항으로 간주되지 않으며, 트레이딩뷰에서 제공하거나 보증하는 것이 아닙니다. 자세한 내용은 이용 약관을 참조하세요.
면책사항
해당 정보와 게시물은 금융, 투자, 트레이딩 또는 기타 유형의 조언이나 권장 사항으로 간주되지 않으며, 트레이딩뷰에서 제공하거나 보증하는 것이 아닙니다. 자세한 내용은 이용 약관을 참조하세요.