
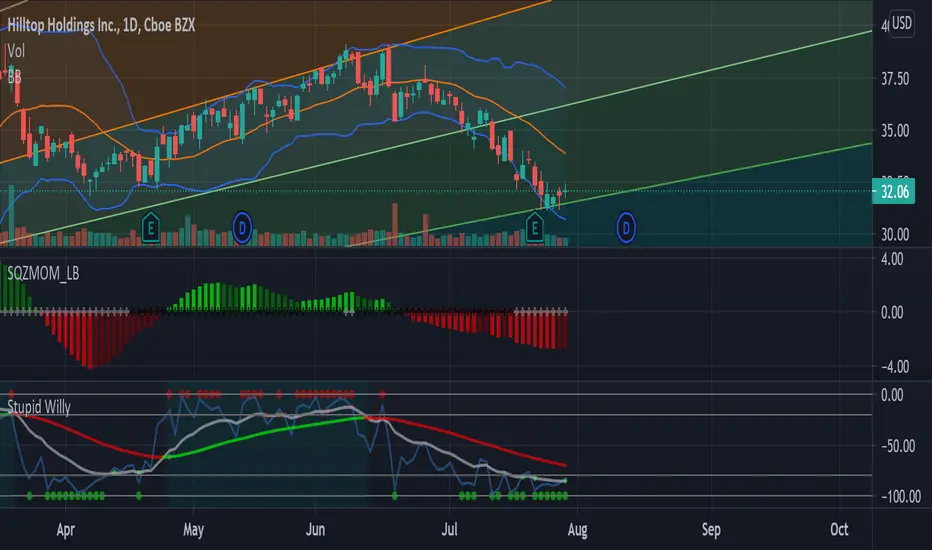
I wanted to see how HTH reacted when faced with its Fibonacci Support and from the looks of it, it showed it has room for bullishness. The squeeze indicator indicated a decline in selling momentum with an additional oversold indication given by the Oscillator. I would swing this stock all the way up to 35-37.
Bullish Signals
-Fibonacci Support Bounce
-Oversold via oscillator
-Squeeze
Price Targets
-1st 35
-2nd 37
Bullish Signals
-Fibonacci Support Bounce
-Oversold via oscillator
-Squeeze
Price Targets
-1st 35
-2nd 37

면책사항
해당 정보와 게시물은 금융, 투자, 트레이딩 또는 기타 유형의 조언이나 권장 사항으로 간주되지 않으며, 트레이딩뷰에서 제공하거나 보증하는 것이 아닙니다. 자세한 내용은 이용 약관을 참조하세요.
면책사항
해당 정보와 게시물은 금융, 투자, 트레이딩 또는 기타 유형의 조언이나 권장 사항으로 간주되지 않으며, 트레이딩뷰에서 제공하거나 보증하는 것이 아닙니다. 자세한 내용은 이용 약관을 참조하세요.