
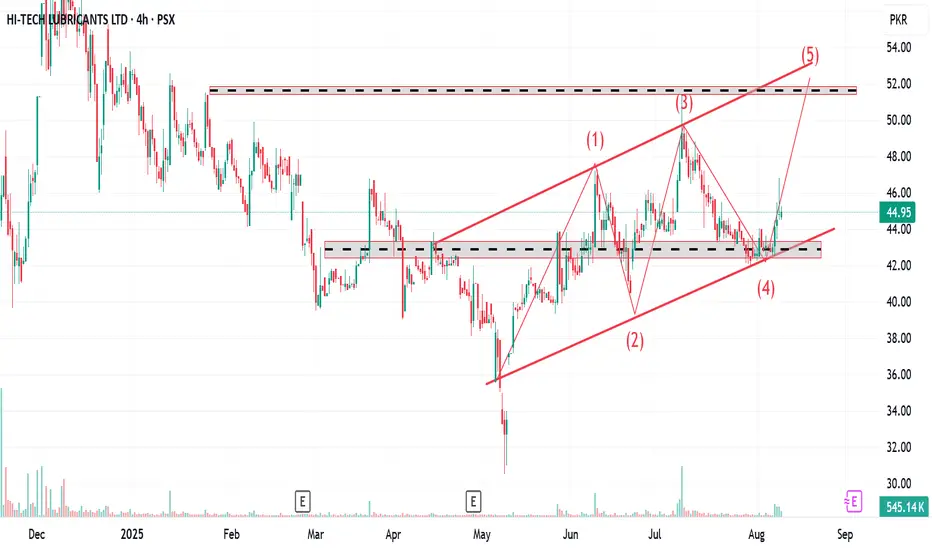
An uptrend channel is a chart pattern where price moves between two parallel, upward-sloping trendlines. The lower line (support) connects higher lows, while the upper line (resistance) connects higher highs.Key Points:
Support: The lower trendline, where price tends to bounce.
Resistance: The upper trendline, where price tends to face selling pressure.
Price Action: Price moves within these lines, forming higher highs and higher lows.
Trading:
Buy near support (lower trendline).
Sell near resistance (upper trendline).
A breakout above resistance or a breakdown below support signals trend continuation or reversal.
It's a bullish pattern indicating sustained upward movement.
Support: The lower trendline, where price tends to bounce.
Resistance: The upper trendline, where price tends to face selling pressure.
Price Action: Price moves within these lines, forming higher highs and higher lows.
Trading:
Buy near support (lower trendline).
Sell near resistance (upper trendline).
A breakout above resistance or a breakdown below support signals trend continuation or reversal.
It's a bullish pattern indicating sustained upward movement.

면책사항
해당 정보와 게시물은 금융, 투자, 트레이딩 또는 기타 유형의 조언이나 권장 사항으로 간주되지 않으며, 트레이딩뷰에서 제공하거나 보증하는 것이 아닙니다. 자세한 내용은 이용 약관을 참조하세요.
면책사항
해당 정보와 게시물은 금융, 투자, 트레이딩 또는 기타 유형의 조언이나 권장 사항으로 간주되지 않으며, 트레이딩뷰에서 제공하거나 보증하는 것이 아닙니다. 자세한 내용은 이용 약관을 참조하세요.