롱
$HTZ technical analysis "HTZ"
$NYSE:HTZ
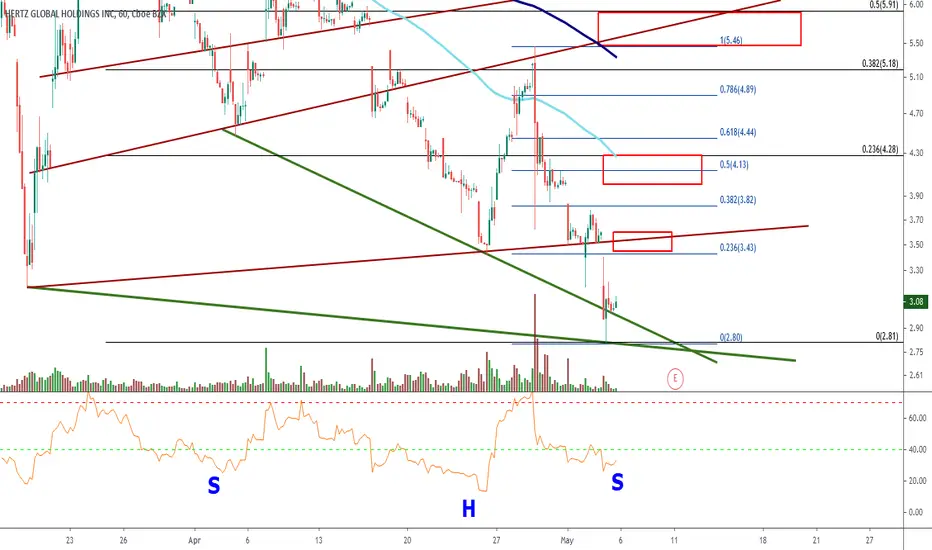
Lot's of bullish signs/patterns played out and are playing out.
If the bottom is in, then we would have formed a double bottom = bullish.
Today's price action resemble a SFP (swing failure pattern) = bullish.
Many bullish divergences on multiple time frames (1hr, 4hr, 1day, weekly) = bullish.
Inverse head and shoulders pattern looks to be completing right shoulder on multiple time frames = bullish.
Recent volume price is declining = bullish.
In the chart I have sell zone boxes in red where I am looking to sell parts of my position.
They also correspond with the red diagonal resistance lines I drew and several EMA's (exponential moving averages: 100, 200, 250, 300)
The green trend lines show support areas.
We don't want price to fall below those areas.
Good luck to all and God bless!
Lot's of bullish signs/patterns played out and are playing out.
If the bottom is in, then we would have formed a double bottom = bullish.
Today's price action resemble a SFP (swing failure pattern) = bullish.
Many bullish divergences on multiple time frames (1hr, 4hr, 1day, weekly) = bullish.
Inverse head and shoulders pattern looks to be completing right shoulder on multiple time frames = bullish.
Recent volume price is declining = bullish.
In the chart I have sell zone boxes in red where I am looking to sell parts of my position.
They also correspond with the red diagonal resistance lines I drew and several EMA's (exponential moving averages: 100, 200, 250, 300)
The green trend lines show support areas.
We don't want price to fall below those areas.
Good luck to all and God bless!

면책사항
해당 정보와 게시물은 금융, 투자, 트레이딩 또는 기타 유형의 조언이나 권장 사항으로 간주되지 않으며, 트레이딩뷰에서 제공하거나 보증하는 것이 아닙니다. 자세한 내용은 이용 약관을 참조하세요.
면책사항
해당 정보와 게시물은 금융, 투자, 트레이딩 또는 기타 유형의 조언이나 권장 사항으로 간주되지 않으며, 트레이딩뷰에서 제공하거나 보증하는 것이 아닙니다. 자세한 내용은 이용 약관을 참조하세요.