
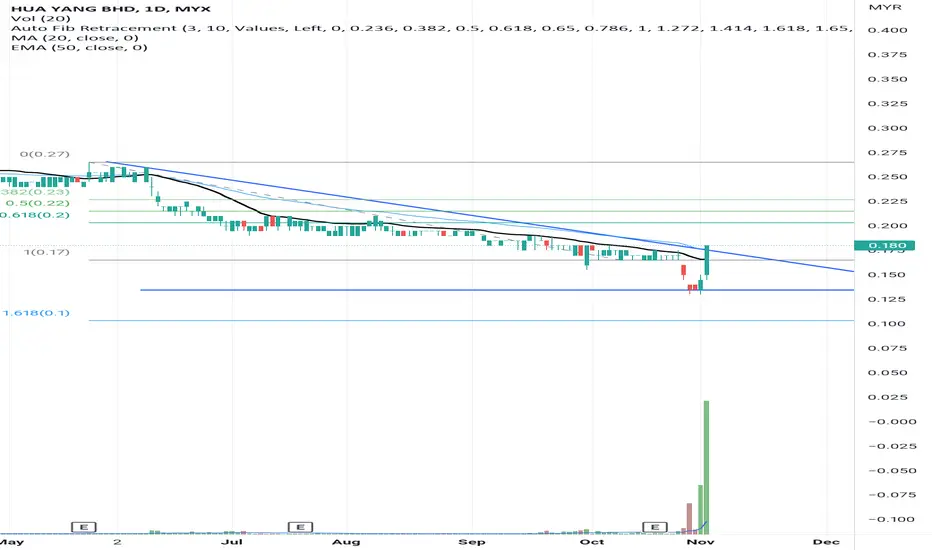
The candlestick indicates a price breakout above the " triangle" pattern neckline on 2 Oct 2022 backend with volumes. Thus, closed above the SMA line where the stock has consolidated and formed a "return move".
The MACD indicates a divergent pattern where confirming the initial significant price movement toward the next price resistance.
The RSI indicates a bullish reading backed by a positive signals in the trend.
Let's save HUAYANG in WL and watch out significant price movement toward the next price resistant backed by volumes.
R 0.195
S 0.160

면책사항
해당 정보와 게시물은 금융, 투자, 트레이딩 또는 기타 유형의 조언이나 권장 사항으로 간주되지 않으며, 트레이딩뷰에서 제공하거나 보증하는 것이 아닙니다. 자세한 내용은 이용 약관을 참조하세요.
면책사항
해당 정보와 게시물은 금융, 투자, 트레이딩 또는 기타 유형의 조언이나 권장 사항으로 간주되지 않으며, 트레이딩뷰에서 제공하거나 보증하는 것이 아닙니다. 자세한 내용은 이용 약관을 참조하세요.