 HYMC
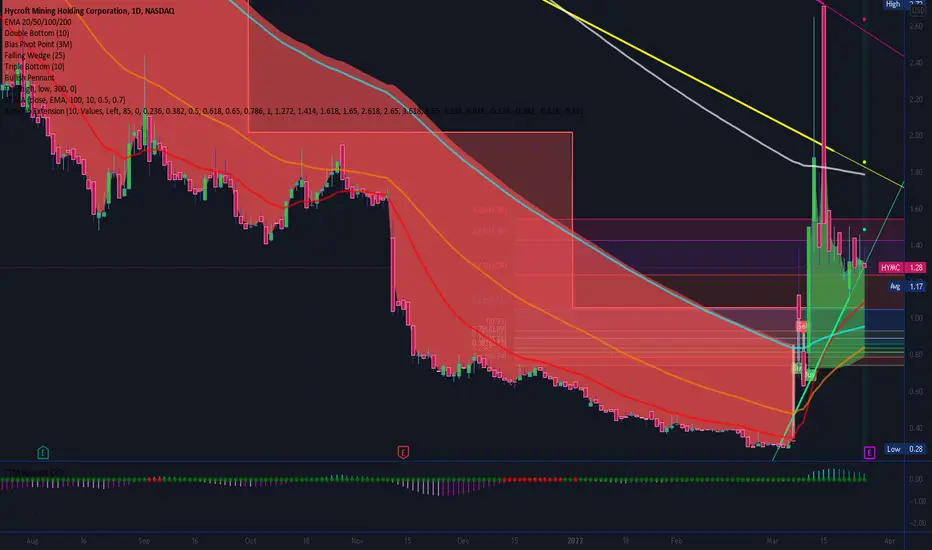
STAKK analysis on the HYMC stock (hycroftmining.com/)
Chart 1 Day
EMA (Exponential Moving Average): Bullish, as the 20EMA has crossed the 50EMA and 100EMA
Red line (20)
Orange line (50)
Blue line (100)
White line (200)
TTM Squeeze: Trending down, meaning momentum is low. Traders may be taking profits. Also notice that gap down on Nov. 9th has been filled.
Fib Levels: Above 2.618. The price has gone parabolic. Price action has to stay above this levels for the bullish trend to continue.
Candle Stick: Last few candles are bearish candles. last day candle is a "Bearish Pin Bar"
Pattern: Current pattern is an Ascending Triangle. This is a bilateral pattern with could result in either a bullish or bearish price action.
News: Hope coming earnings. On March 15th, AMC bought into the company ($194 Million)
History: Price have crashed on earnings report.
Bullish case: Price action could move to the $1.48 to $1.85 to $2.62 (each are major resistance areas).
Bearish case: Price could drop down to $.93 (1 fib) or $.73 (0 fib)

STAKK
면책사항
해당 정보와 게시물은 금융, 투자, 트레이딩 또는 기타 유형의 조언이나 권장 사항으로 간주되지 않으며, 트레이딩뷰에서 제공하거나 보증하는 것이 아닙니다. 자세한 내용은 이용 약관을 참조하세요.
STAKK
면책사항
해당 정보와 게시물은 금융, 투자, 트레이딩 또는 기타 유형의 조언이나 권장 사항으로 간주되지 않으며, 트레이딩뷰에서 제공하거나 보증하는 것이 아닙니다. 자세한 내용은 이용 약관을 참조하세요.