
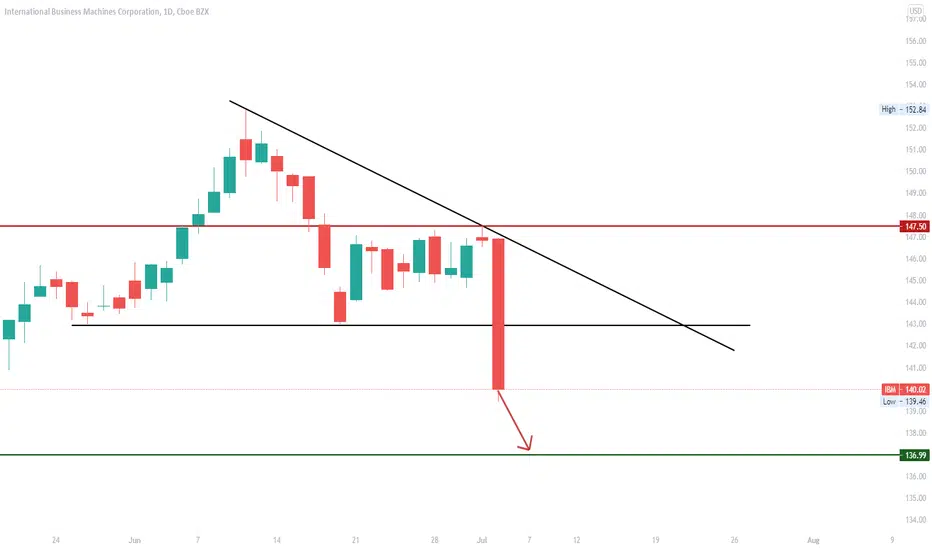
We have a technical figure Descending Triangle in US company International Business Machines Corporation (IBM) at daily chart. IBM is an American multinational technology company. IBM produces and sells computer hardware, middleware, and software, and provides hosting and consulting services in areas ranging from mainframe computers to nanotechnology. The Descending Triangle has broken through the support line on 03/07/2021, if the price holds below this level we can have a possible bearish price movement with a forecast for the next 9 days towards 136.99 USD. Our stop loss order should be placed at 147.50 USD if we decide to enter this position.

면책사항
해당 정보와 게시물은 금융, 투자, 트레이딩 또는 기타 유형의 조언이나 권장 사항으로 간주되지 않으며, 트레이딩뷰에서 제공하거나 보증하는 것이 아닙니다. 자세한 내용은 이용 약관을 참조하세요.
면책사항
해당 정보와 게시물은 금융, 투자, 트레이딩 또는 기타 유형의 조언이나 권장 사항으로 간주되지 않으며, 트레이딩뷰에서 제공하거나 보증하는 것이 아닙니다. 자세한 내용은 이용 약관을 참조하세요.