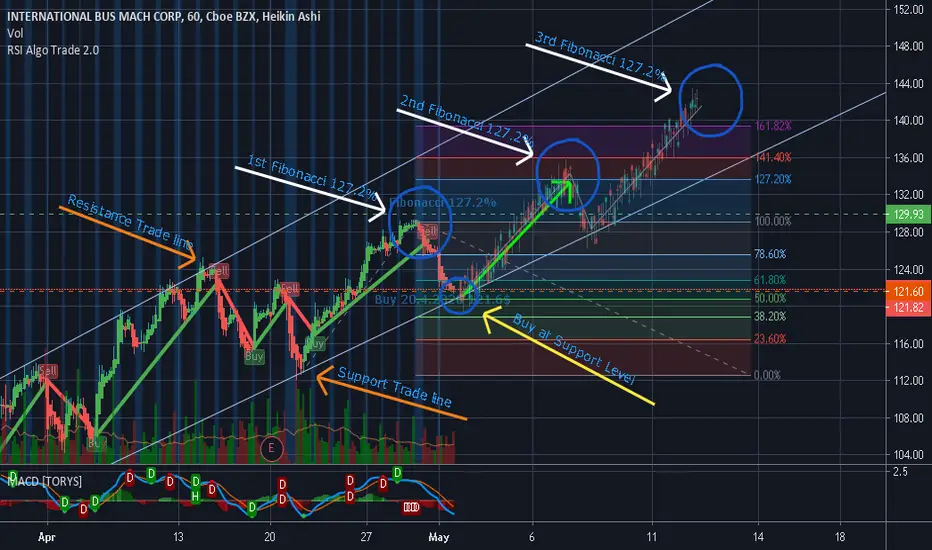
This trade analysis based on two levels, the support trade line and the resistance trade line (Orange color arrow).
When the stock IBM reach the 1st Fibonacci 127.2% it follow the Fibonacci retrace down to 61% - 50% and reach the Support trade line. At this moment, around 121$, its the time to take a profit at the 2nd Fibonacci 127% level. As well as for the 3rd ..... (144$)
When you look the MACD indicator it's will be the good time to buy the stock at low level
When the stock
IBM reach the 1st Fibonacci 127.2% it follow the Fibonacci retrace down to 61% - 50% and reach the Support trade line. At this moment, around 121$, its the time to take a profit at the 2nd Fibonacci 127% level. As well as for the 3rd ..... (144$)When you look the MACD indicator it's will be the good time to buy the stock at low level

면책사항
해당 정보와 게시물은 금융, 투자, 트레이딩 또는 기타 유형의 조언이나 권장 사항으로 간주되지 않으며, 트레이딩뷰에서 제공하거나 보증하는 것이 아닙니다. 자세한 내용은 이용 약관을 참조하세요.
면책사항
해당 정보와 게시물은 금융, 투자, 트레이딩 또는 기타 유형의 조언이나 권장 사항으로 간주되지 않으며, 트레이딩뷰에서 제공하거나 보증하는 것이 아닙니다. 자세한 내용은 이용 약관을 참조하세요.