
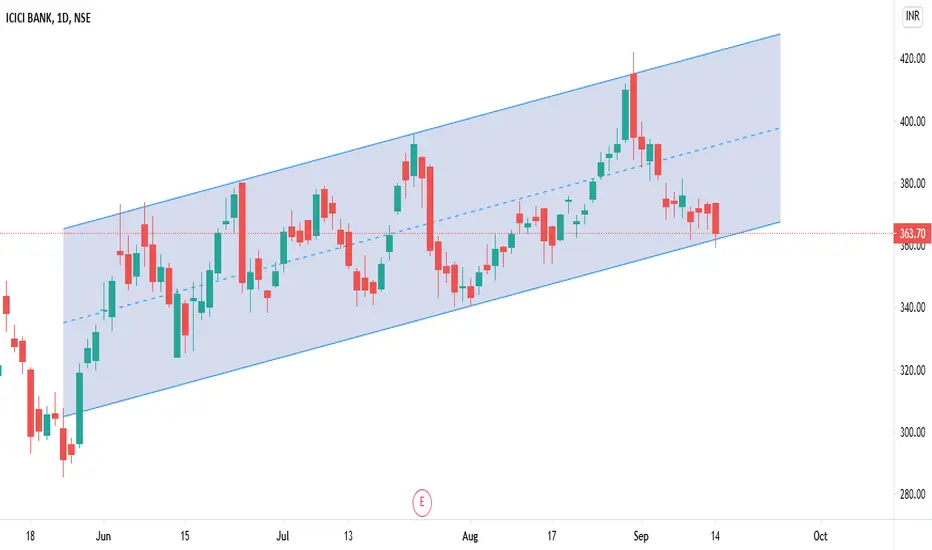
ICICI BANK is moving in a parallel channel and has reached it's lower part, where, it has taken support in the past. 353-354 seems to be the deciding level for the stock in short term. Big Change only on moving below 337-338. It has to sustain below the mentioned levels and not just be another trap, like it happened at he top of the channel. Will it take support at the channel and bounce back or break for the downside and halt around 350s? I'm learning chart patterns as of now. You can plan your trades accordingly if you know how to trade these patterns.

관련 발행물
면책사항
해당 정보와 게시물은 금융, 투자, 트레이딩 또는 기타 유형의 조언이나 권장 사항으로 간주되지 않으며, 트레이딩뷰에서 제공하거나 보증하는 것이 아닙니다. 자세한 내용은 이용 약관을 참조하세요.
관련 발행물
면책사항
해당 정보와 게시물은 금융, 투자, 트레이딩 또는 기타 유형의 조언이나 권장 사항으로 간주되지 않으며, 트레이딩뷰에서 제공하거나 보증하는 것이 아닙니다. 자세한 내용은 이용 약관을 참조하세요.