
📍 Latest Share Price (as of Mar 2–3, 2026)
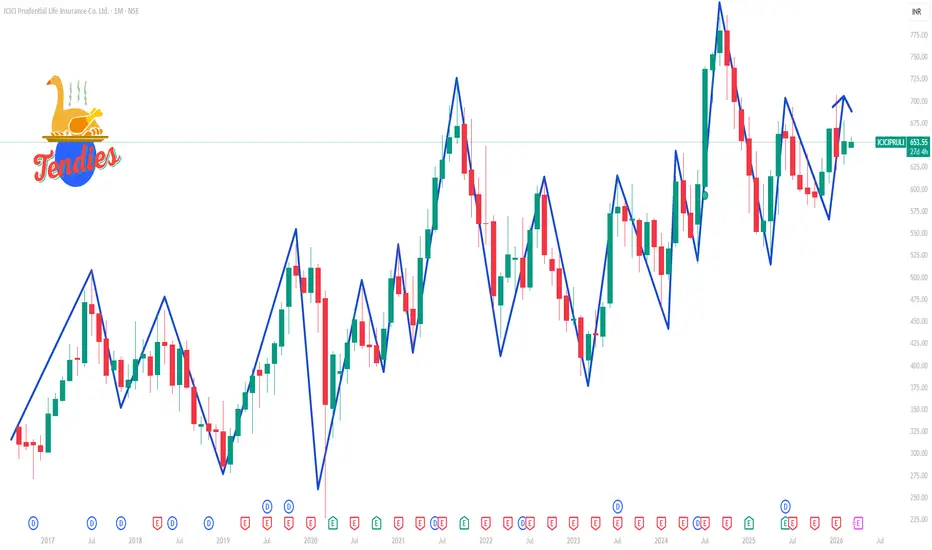
Current Price: ~₹653 – ₹655 per share (in recent trading sessions).
Most recent close: ~₹653.55.
Day range: roughly ₹646 – ₹659 on the latest trading day.
52-week range: ₹525.80 – ₹706.80 (low–high).
📊 These figures are from major Indian exchanges (NSE/BSE), reflecting live or very recent last-traded prices.
📅 1-Month Trend / Level Movement
Based on historical price data over the past month:
📈 Approximate 1-Month Shift:
The share price has shown modest movement — generally fluctuating around the ₹640 – ₹670 range over the past month.
Short-term 1-month return is mixed/slightly positive (moderate increase ~1–2%), as per recent short-term technical summaries.
🕒 What this means:
Over the past 1 month — a short time frame — the stock has not shown strong trending movement; it has generally stayed around current levels with moderate volatility.
📌 How to View This
If you’re interested in a 1-month chart, select the “1M” option on a live stock market chart platform (e.g., tradingview, NSE/BSE quote pages). That gives a visual line showing closing prices over the last ~20 trading days.
📊 A 1-month “level view” shows how the share price moves recently — not long-term gains/losses — and can be useful for short-term analysis or technical indicators.
⚠️ Notes
✔ This is stock price data — not insurance policy performance.
✔ Insurance policy returns (ULIPs, etc.) are completely different from share prices.
✔ Share prices change every trading day based on market forces.
Current Price: ~₹653 – ₹655 per share (in recent trading sessions).
Most recent close: ~₹653.55.
Day range: roughly ₹646 – ₹659 on the latest trading day.
52-week range: ₹525.80 – ₹706.80 (low–high).
📊 These figures are from major Indian exchanges (NSE/BSE), reflecting live or very recent last-traded prices.
📅 1-Month Trend / Level Movement
Based on historical price data over the past month:
📈 Approximate 1-Month Shift:
The share price has shown modest movement — generally fluctuating around the ₹640 – ₹670 range over the past month.
Short-term 1-month return is mixed/slightly positive (moderate increase ~1–2%), as per recent short-term technical summaries.
🕒 What this means:
Over the past 1 month — a short time frame — the stock has not shown strong trending movement; it has generally stayed around current levels with moderate volatility.
📌 How to View This
If you’re interested in a 1-month chart, select the “1M” option on a live stock market chart platform (e.g., tradingview, NSE/BSE quote pages). That gives a visual line showing closing prices over the last ~20 trading days.
📊 A 1-month “level view” shows how the share price moves recently — not long-term gains/losses — and can be useful for short-term analysis or technical indicators.
⚠️ Notes
✔ This is stock price data — not insurance policy performance.
✔ Insurance policy returns (ULIPs, etc.) are completely different from share prices.
✔ Share prices change every trading day based on market forces.

Contact Knowledgehub for a detailed consultation: Dm on WhatsApp: [wa.link/a2o0kz]-
Phone No: [+91 93102 26243]-
Email: [tradingviewknowledgehub@gmail.com]---
-- Let’s achieve success together!
Phone No: [+91 93102 26243]-
Email: [tradingviewknowledgehub@gmail.com]---
-- Let’s achieve success together!
관련 발행물
면책사항
해당 정보와 게시물은 금융, 투자, 트레이딩 또는 기타 유형의 조언이나 권장 사항으로 간주되지 않으며, 트레이딩뷰에서 제공하거나 보증하는 것이 아닙니다. 자세한 내용은 이용 약관을 참조하세요.
Contact Knowledgehub for a detailed consultation: Dm on WhatsApp: [wa.link/a2o0kz]-
Phone No: [+91 93102 26243]-
Email: [tradingviewknowledgehub@gmail.com]---
-- Let’s achieve success together!
Phone No: [+91 93102 26243]-
Email: [tradingviewknowledgehub@gmail.com]---
-- Let’s achieve success together!
관련 발행물
면책사항
해당 정보와 게시물은 금융, 투자, 트레이딩 또는 기타 유형의 조언이나 권장 사항으로 간주되지 않으며, 트레이딩뷰에서 제공하거나 보증하는 것이 아닙니다. 자세한 내용은 이용 약관을 참조하세요.