Long
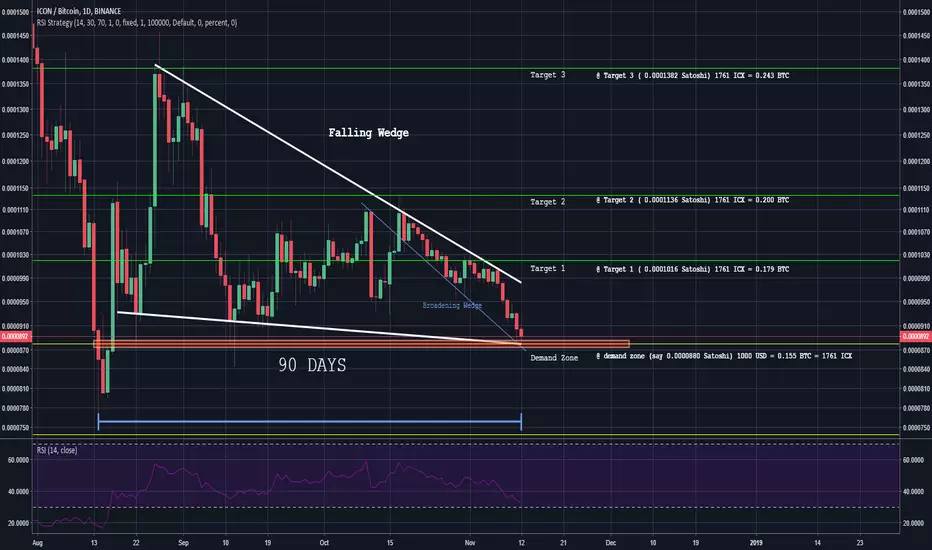
IcOn - Ethereum's alternative - bottom 0.0000880
First of all - Technical analysis of any sort is based on historical price action. Any future price action prediction is a theoretical view of an author in regards to speculated price movement.
Trader/analyst/investor by using chosen set of tools hopes to gain profit from those trading pairs which seems to follow rigoristic criteria.
Icon/Bitcoin is now one of those pairs from my point of view.
Major focus :
1. Theory: my ideas always fail.
2. A trend is your friend.
3. Importance of Rsi (Relative Strength Index).
4. Patterns / Formations.
Analysis :
It is obvious that we are certainly not in a bull market. As an author of this analysis, I am assuming we found a bottom in the ICX/BTC pair. RSI indicates signs of bullish divergence (12'th of September vs 12'th of November) - volume is dropping, bears are slowly losing steam. We can clearly see falling wedge (white) and bullish broadening wedge (blue) - both indicate a possible change of price movement to the upside. Targets are divided into 2 categories (green and yellow) - green is most likely to happen in a relatively short period of time (up to 90 days) yellow is a longer term investment. If bottom at 0.0000880 is broken and candle closes below, we can expect the price to drop down to previous low (around 0.0000770) - I would advise here tight Stop-Loss at 0.0000840 level.
This analysis will be regularly updated.
Trader/analyst/investor by using chosen set of tools hopes to gain profit from those trading pairs which seems to follow rigoristic criteria.
Icon/Bitcoin is now one of those pairs from my point of view.
Major focus :
1. Theory: my ideas always fail.
2. A trend is your friend.
3. Importance of Rsi (Relative Strength Index).
4. Patterns / Formations.
Analysis :
It is obvious that we are certainly not in a bull market. As an author of this analysis, I am assuming we found a bottom in the ICX/BTC pair. RSI indicates signs of bullish divergence (12'th of September vs 12'th of November) - volume is dropping, bears are slowly losing steam. We can clearly see falling wedge (white) and bullish broadening wedge (blue) - both indicate a possible change of price movement to the upside. Targets are divided into 2 categories (green and yellow) - green is most likely to happen in a relatively short period of time (up to 90 days) yellow is a longer term investment. If bottom at 0.0000880 is broken and candle closes below, we can expect the price to drop down to previous low (around 0.0000770) - I would advise here tight Stop-Loss at 0.0000840 level.
This analysis will be regularly updated.
액티브 트레이드
Moved stop-loss to 0.0000820 due to bullish divergence :노트
Divergence seen on smaller time frame (1h)노트
4H oversold :
관련 발행물
면책사항
해당 정보와 게시물은 금융, 투자, 트레이딩 또는 기타 유형의 조언이나 권장 사항으로 간주되지 않으며, 트레이딩뷰에서 제공하거나 보증하는 것이 아닙니다. 자세한 내용은 이용 약관을 참조하세요.
면책사항
해당 정보와 게시물은 금융, 투자, 트레이딩 또는 기타 유형의 조언이나 권장 사항으로 간주되지 않으며, 트레이딩뷰에서 제공하거나 보증하는 것이 아닙니다. 자세한 내용은 이용 약관을 참조하세요.