찾기
프로덕트
커뮤니티
마켓
브로커
더보기
KO
지금 시작
숏
업데이트됨
2018년 5월 20일
ICON
3
이 차트 보기
1
520
2018년 5월 19일
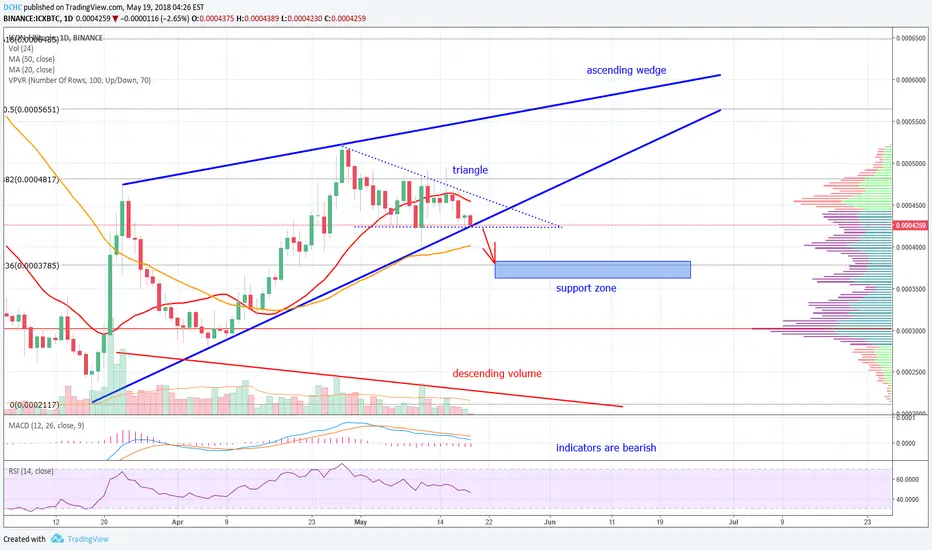
Hi my friends, here is ICX chart.
Majkee
2018년 5월 20일
노트
candle close under the blue trend line and we are still inside the dotted small triangle, way to support zone is still open
2018년 5월 21일
노트
Akcier
팔로우
팔로잉
또한 다음에서도:
Chart Patterns
Technical Indicators
Trend Analysis
관련 발행물
BitShares cup and handle
Akcier의
STRATIS -triangle + cup and handle pattern?
Akcier의
WAVES - bullish wedge + divergence
Akcier의
STEEM - buying prediction
Akcier의
Cardano
Akcier의
NEO
Akcier의
Stellar - head and shoulder
Akcier의
VeChain
Akcier의
PIVX
Akcier의
SUBSTRATUM
Akcier의
ETHEREUM
Akcier의
Bitcoin - reversal head and shoulders + waves
Akcier의
면책사항
해당 정보와 게시물은 금융, 투자, 트레이딩 또는 기타 유형의 조언이나 권장 사항으로 간주되지 않으며, 트레이딩뷰에서 제공하거나 보증하는 것이 아닙니다. 자세한 내용은
이용 약관
을 참조하세요.
Chart Patterns
Technical Indicators
Trend Analysis
Akcier
팔로우
팔로잉
또한 다음에서도:
관련 발행물
BitShares cup and handle
Akcier의
STRATIS -triangle + cup and handle pattern?
Akcier의
WAVES - bullish wedge + divergence
Akcier의
STEEM - buying prediction
Akcier의
Cardano
Akcier의
NEO
Akcier의
Stellar - head and shoulder
Akcier의
VeChain
Akcier의
PIVX
Akcier의
SUBSTRATUM
Akcier의
ETHEREUM
Akcier의
Bitcoin - reversal head and shoulders + waves
Akcier의
면책사항
해당 정보와 게시물은 금융, 투자, 트레이딩 또는 기타 유형의 조언이나 권장 사항으로 간주되지 않으며, 트레이딩뷰에서 제공하거나 보증하는 것이 아닙니다. 자세한 내용은
이용 약관
을 참조하세요.