롱
IDFC BULLISH
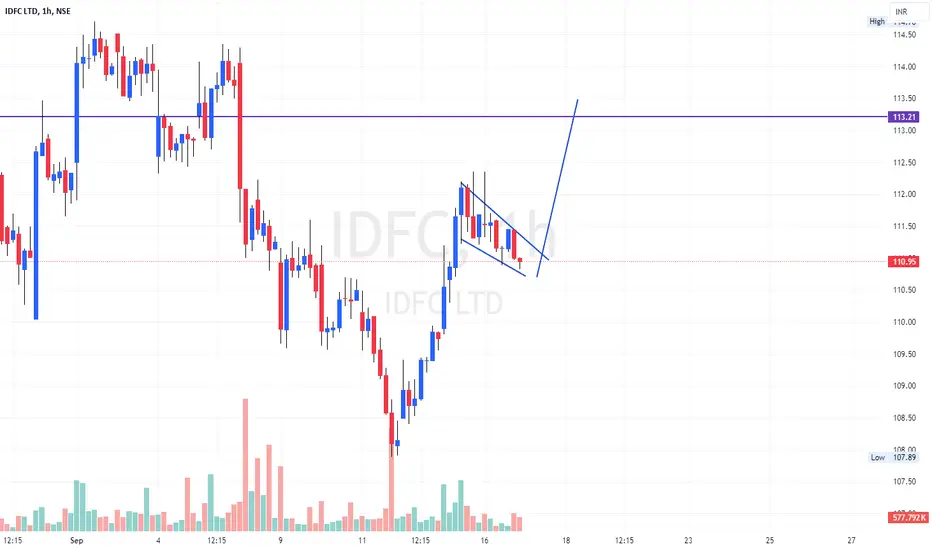
A Bullish Flag is a technical analysis pattern that suggests a potential continuation of a bullish trend. Here's a description of the Bullish Flag pattern in IDFC :
Pattern Description:
Flagpole: The stock price of IDFC has been in a strong uptrend, forming a flagpole (a sharp, almost vertical rise in price).
Consolidation: After the flagpole, the stock price has consolidated within a narrow range, forming a flag (a rectangular or triangular shape).
Upper and Lower Boundaries: The flag has upper and lower boundaries, which are roughly parallel to each other.
Breakout: The stock price is expected to break out above the upper boundary of the flag, continuing the bullish trend.
Pattern Description:
Flagpole: The stock price of IDFC has been in a strong uptrend, forming a flagpole (a sharp, almost vertical rise in price).
Consolidation: After the flagpole, the stock price has consolidated within a narrow range, forming a flag (a rectangular or triangular shape).
Upper and Lower Boundaries: The flag has upper and lower boundaries, which are roughly parallel to each other.
Breakout: The stock price is expected to break out above the upper boundary of the flag, continuing the bullish trend.
노트
SL hit
면책사항
해당 정보와 게시물은 금융, 투자, 트레이딩 또는 기타 유형의 조언이나 권장 사항으로 간주되지 않으며, 트레이딩뷰에서 제공하거나 보증하는 것이 아닙니다. 자세한 내용은 이용 약관을 참조하세요.
면책사항
해당 정보와 게시물은 금융, 투자, 트레이딩 또는 기타 유형의 조언이나 권장 사항으로 간주되지 않으며, 트레이딩뷰에서 제공하거나 보증하는 것이 아닙니다. 자세한 내용은 이용 약관을 참조하세요.