
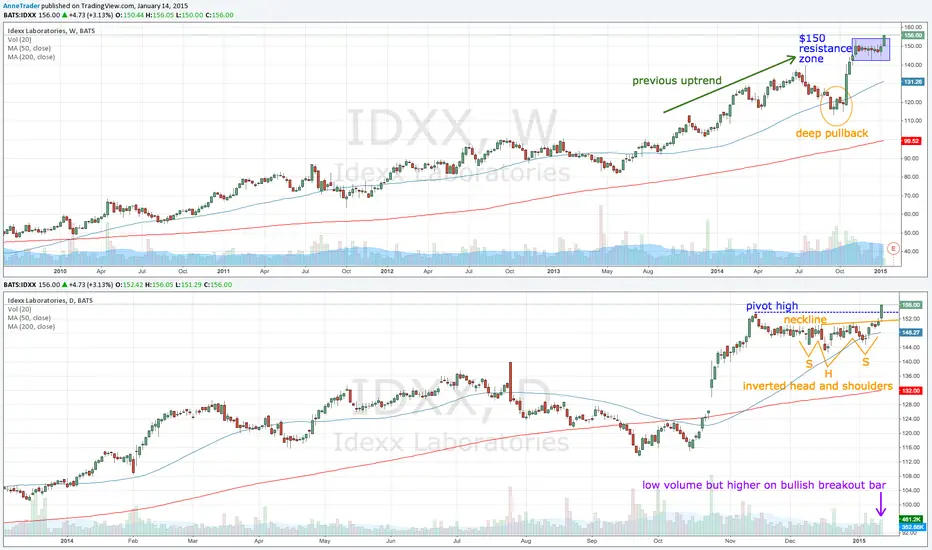
IDXX has just broken up out of a nine week pullback. Price struggled to break above the $150 half-figure zone during that time. Prior to this there was a very deep pullback (September/October 2014) which broke below the weekly 50ma for several weeks.
However, price is currently in an uptrend, despite the recent pullback - which, in fact, formed an inverted head and shoulders pattern suggesting a continuation to the upside. This was confirmed on yesterdays breakout bar - which also broke above the recent pivot high. Volume was up on the bullish bar, too, which all points to a continuation of the uptrend.
Overall, volume is on the low side (which could affect liquidity) but otherwise a good long opportunity.
However, price is currently in an uptrend, despite the recent pullback - which, in fact, formed an inverted head and shoulders pattern suggesting a continuation to the upside. This was confirmed on yesterdays breakout bar - which also broke above the recent pivot high. Volume was up on the bullish bar, too, which all points to a continuation of the uptrend.
Overall, volume is on the low side (which could affect liquidity) but otherwise a good long opportunity.

Web: dt.live
Instagram: instagram.com/dynamictrader
Twitter: twitter.com/dynamictrader
Instagram: instagram.com/dynamictrader
Twitter: twitter.com/dynamictrader
면책사항
해당 정보와 게시물은 금융, 투자, 트레이딩 또는 기타 유형의 조언이나 권장 사항으로 간주되지 않으며, 트레이딩뷰에서 제공하거나 보증하는 것이 아닙니다. 자세한 내용은 이용 약관을 참조하세요.
Web: dt.live
Instagram: instagram.com/dynamictrader
Twitter: twitter.com/dynamictrader
Instagram: instagram.com/dynamictrader
Twitter: twitter.com/dynamictrader
면책사항
해당 정보와 게시물은 금융, 투자, 트레이딩 또는 기타 유형의 조언이나 권장 사항으로 간주되지 않으며, 트레이딩뷰에서 제공하거나 보증하는 것이 아닙니다. 자세한 내용은 이용 약관을 참조하세요.