Long
Bullish- Long Play
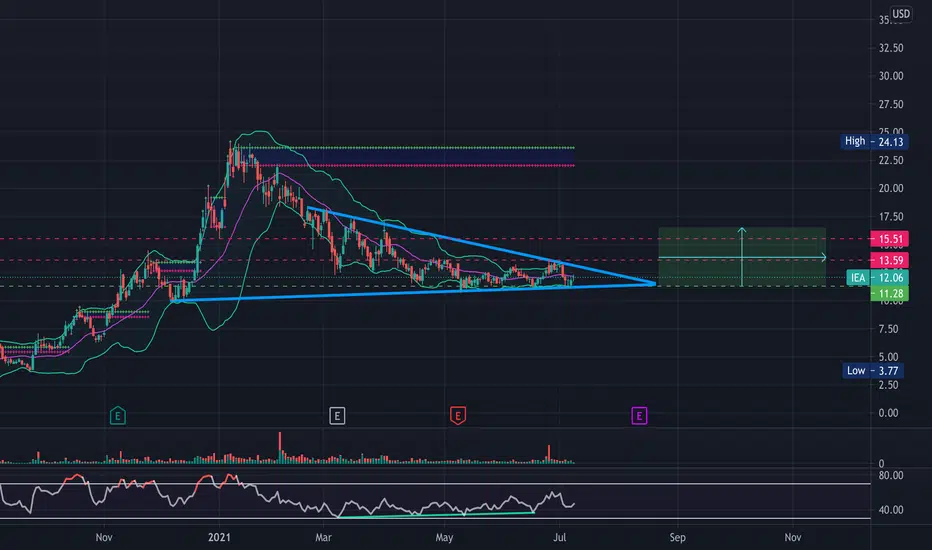
- IEA has been consolidating in this triangle for quite some time now. Undoubtably a long-term play, has held its support and looks to have found a bottom, with volume should really pop
- Hidden bullish divergence on the RSI
- Bollinger Bands squeezing indicating a big move
- Buyer volume starting to pick up again
- Held support at the $11.28 level, has resistance circa $13.59 and $15.51
PT1- $13.65
PT2- $14.80
PT3- $15.75
- Hidden bullish divergence on the RSI
- Bollinger Bands squeezing indicating a big move
- Buyer volume starting to pick up again
- Held support at the $11.28 level, has resistance circa $13.59 and $15.51
PT1- $13.65
PT2- $14.80
PT3- $15.75
노트
노트
IEA is nearing the end of the symmetrical triangle previously charted. While still holding that formation is also forming what appears to be a falling wedge ( bullish ). Bollinger bands are squeezing along with a MACD cross to close on Friday. Just some support and resistance levels to watch, see updated chart. Bullish will be looking for a breakout-노트
Price Target 1 reached ✅
면책사항
해당 정보와 게시물은 금융, 투자, 트레이딩 또는 기타 유형의 조언이나 권장 사항으로 간주되지 않으며, 트레이딩뷰에서 제공하거나 보증하는 것이 아닙니다. 자세한 내용은 이용 약관을 참조하세요.
면책사항
해당 정보와 게시물은 금융, 투자, 트레이딩 또는 기타 유형의 조언이나 권장 사항으로 간주되지 않으며, 트레이딩뷰에서 제공하거나 보증하는 것이 아닙니다. 자세한 내용은 이용 약관을 참조하세요.