
Tech-Software Reversal? 3 Key Signals Confirming a Market Bottom
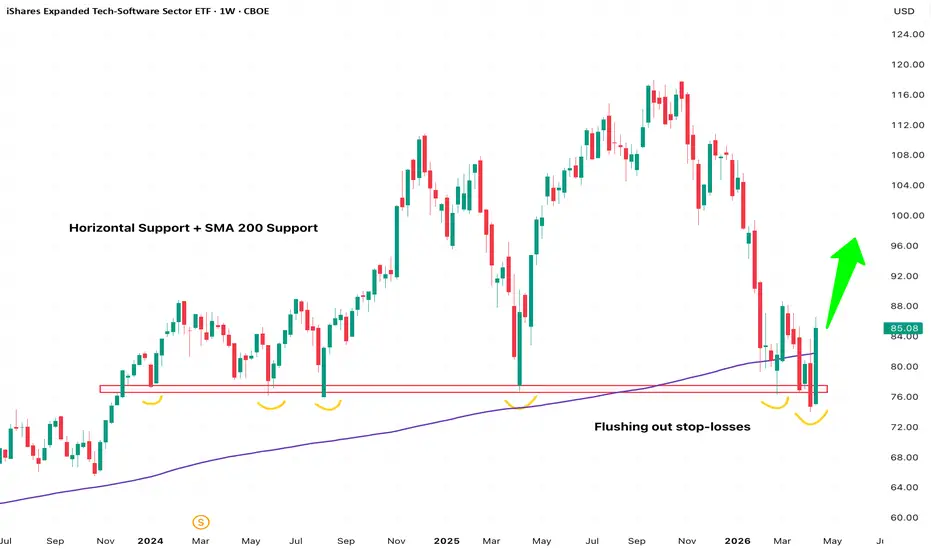
IGV Tech-Software Sector: Potential Bottom Confirmed by Key Technical Confluence
Based on the weekly chart of IGV (iShares Expanded Tech-Software Sector ETF), the price action suggests a solid base has been formed. Multiple bullish technical signals are converging, indicating a high probability of an upward reversal.
Here are the three core rationales supporting this bullish outlook:
Strong Horizontal Support: The price is currently consolidating in a critical demand zone around the $78 level. Historical data shows this horizontal support line has been tested and respected approximately 7 times. This repeated validation proves the level is highly effective with strong underlying buying interest.
Takeout Stops Pattern (False Breakdown): Between late March and early April, the price action executed a textbook liquidity grab (takeout stops). It briefly dipped below the established horizontal support—flushing out long stop-losses—before immediately reversing and closing green back above the line. This false breakdown is a strong reversal signal indicating institutional accumulation.
SMA 200 Support & Bullish Engulfing: The most recent weekly candle printed a powerful "Bullish Engulfing" pattern. Crucially, the closing price decisively reclaimed the long-term 200-Week Simple Moving Average (SMA 200).
Conclusion:
The exact overlapping of these three factors—a heavily tested horizontal base, a rapid takeout of stops, and the reclaiming of the 200-Week SMA—provides strong conviction that this zone is a recognized market bottom. This structure offers a highly favorable risk-to-reward ratio for mid-to-long-term positioning.
Risk Management:
Regardless of the high-probability setup, a disciplined trader must always implement a strict stop-loss to manage downside risk.
Based on the weekly chart of IGV (iShares Expanded Tech-Software Sector ETF), the price action suggests a solid base has been formed. Multiple bullish technical signals are converging, indicating a high probability of an upward reversal.
Here are the three core rationales supporting this bullish outlook:
Strong Horizontal Support: The price is currently consolidating in a critical demand zone around the $78 level. Historical data shows this horizontal support line has been tested and respected approximately 7 times. This repeated validation proves the level is highly effective with strong underlying buying interest.
Takeout Stops Pattern (False Breakdown): Between late March and early April, the price action executed a textbook liquidity grab (takeout stops). It briefly dipped below the established horizontal support—flushing out long stop-losses—before immediately reversing and closing green back above the line. This false breakdown is a strong reversal signal indicating institutional accumulation.
SMA 200 Support & Bullish Engulfing: The most recent weekly candle printed a powerful "Bullish Engulfing" pattern. Crucially, the closing price decisively reclaimed the long-term 200-Week Simple Moving Average (SMA 200).
Conclusion:
The exact overlapping of these three factors—a heavily tested horizontal base, a rapid takeout of stops, and the reclaiming of the 200-Week SMA—provides strong conviction that this zone is a recognized market bottom. This structure offers a highly favorable risk-to-reward ratio for mid-to-long-term positioning.
Risk Management:
Regardless of the high-probability setup, a disciplined trader must always implement a strict stop-loss to manage downside risk.

면책사항
해당 정보와 게시물은 금융, 투자, 트레이딩 또는 기타 유형의 조언이나 권장 사항으로 간주되지 않으며, 트레이딩뷰에서 제공하거나 보증하는 것이 아닙니다. 자세한 내용은 이용 약관을 참조하세요.
면책사항
해당 정보와 게시물은 금융, 투자, 트레이딩 또는 기타 유형의 조언이나 권장 사항으로 간주되지 않으며, 트레이딩뷰에서 제공하거나 보증하는 것이 아닙니다. 자세한 내용은 이용 약관을 참조하세요.