
Hello Crypto Lovers,
Mars Signals team wishes you high profits.
This is a 4-hour-time frame analysis for IMXUSDT
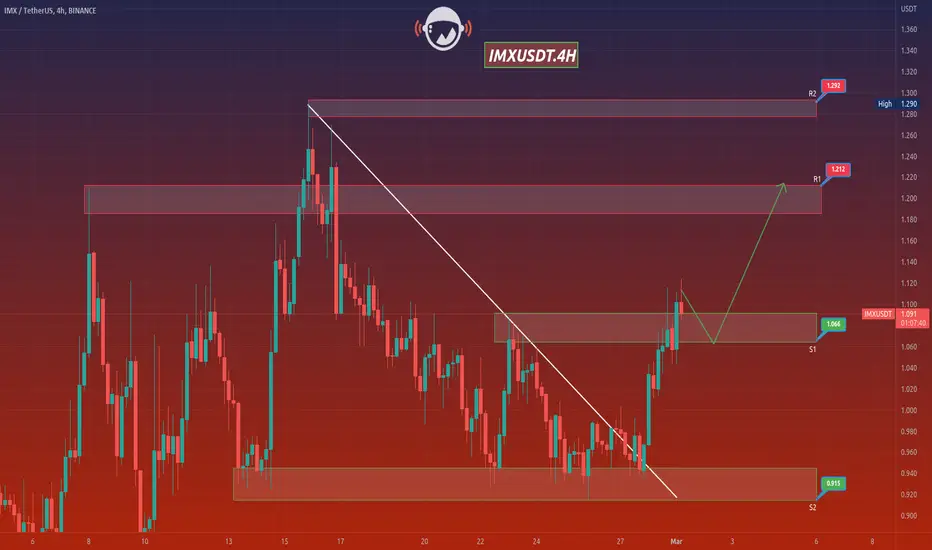
In the current chart, R2 and R1 are the resistance areas which contain the unsuccessful attempts of the price to rise. S1 used to be a resistance line. And S2 is our long-term support area at the bottom expressing the well support of price at several points. Therefore, the price could break S1 upward and we see its fluctuation above this area. The existence of a red candle means the price would have another fall to reach the bottom of S1 and then by providing us some confirmation candles for a rise, there is a possibility of an increase up to R1 and even higher than that. You know that in case the price loses the support at any point and falls below S1 area, surely more decline happens to it. We recommend you to have every piece of information and idea via our analyses for receiving more profitable trades.
Warning: This is just a suggestion and we do not guarantee profits. We advise you to analyze the chart before opening any positions.
Wish you luck
Mars Signals team wishes you high profits.
This is a 4-hour-time frame analysis for IMXUSDT
In the current chart, R2 and R1 are the resistance areas which contain the unsuccessful attempts of the price to rise. S1 used to be a resistance line. And S2 is our long-term support area at the bottom expressing the well support of price at several points. Therefore, the price could break S1 upward and we see its fluctuation above this area. The existence of a red candle means the price would have another fall to reach the bottom of S1 and then by providing us some confirmation candles for a rise, there is a possibility of an increase up to R1 and even higher than that. You know that in case the price loses the support at any point and falls below S1 area, surely more decline happens to it. We recommend you to have every piece of information and idea via our analyses for receiving more profitable trades.
Warning: This is just a suggestion and we do not guarantee profits. We advise you to analyze the chart before opening any positions.
Wish you luck

면책사항
해당 정보와 게시물은 금융, 투자, 트레이딩 또는 기타 유형의 조언이나 권장 사항으로 간주되지 않으며, 트레이딩뷰에서 제공하거나 보증하는 것이 아닙니다. 자세한 내용은 이용 약관을 참조하세요.
면책사항
해당 정보와 게시물은 금융, 투자, 트레이딩 또는 기타 유형의 조언이나 권장 사항으로 간주되지 않으며, 트레이딩뷰에서 제공하거나 보증하는 것이 아닙니다. 자세한 내용은 이용 약관을 참조하세요.